Errored Seconds (ES) metric: Method of calculation
This page explains the fine points of how the errored seconds (ES) metric is calculated.
In each of your monitoring sessions, your Test Agents periodically collect measurement data in 10-second intervals, then compile the results into measurement reports and send them to the Routing Active Testing server. The measurement data can be said to have a resolution of 10 seconds.
Now suppose that within one 10-second interval, there were two seconds during which a Test Agent measured a high level of packet loss or delays. The measurement report will then indicate 2 out of 10 seconds in error = 20% errored seconds (ES). In the Routing Active Testing user interface, this is displayed as a red bar representing an ES percentage between 10% and 49%.
In the user interface, you can zoom in on a time interval, drilling progressively deeper into the details of the measurement history. Conversely, as you zoom out a graph, you might see the colors (= error levels) in the graph changing. This is because the measurement resolution changes along with the zoom setting, as detailed here. For instance, zooming out from the “last 15 minutes” to the “last 24 hours” will change the resolution from 10 seconds to 30 seconds. Two errored seconds, as in the above example, then no longer correspond to an ES percentage of 20% but rather to 6.7%.
Assume now that the packet loss is presented in a graph or table as 0.8% during a 10-second interval (measurement resolution = 10 seconds). This triggered an ES, although you set the ES threshold at 1% packet loss. How come?
The explanation is that the packet loss may have occurred in a burst rather than being evenly distributed over the 10 seconds. For example, you might have had 8% packet loss during a single second, which triggered an ES for that second, and no packet loss the rest of the time. The detailed table will indicate an ES percentage of 10% (one out of ten seconds), that is, the percentage of seconds when the packet loss was above your threshold.
Note
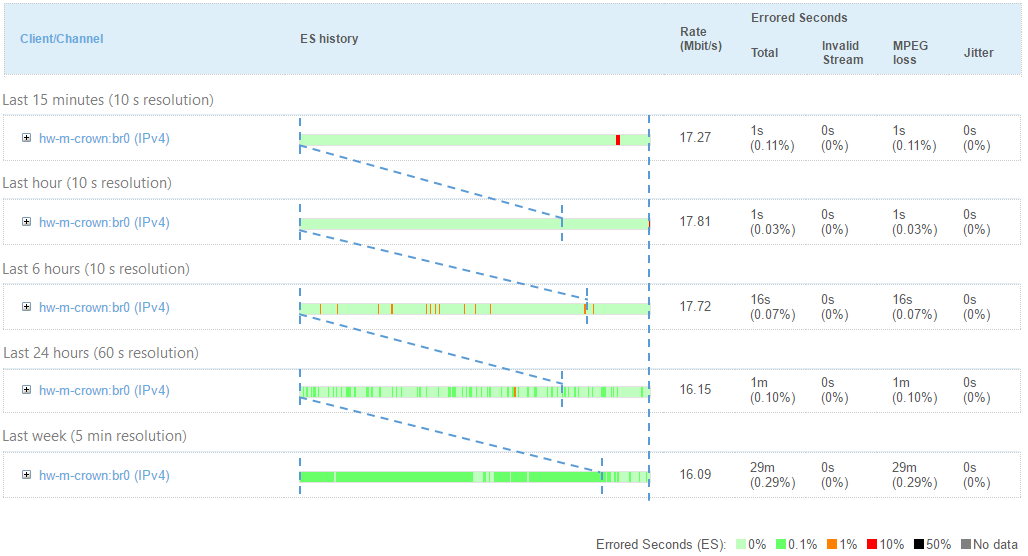
The image below is provided only to illustrate time intervals of increasing lengths; the data does not correspond to the numbers discussed above.
Errored second calculation for delay
Uniquely among metrics output by Test Agents, the delay metric is reported in the form of minimum, maximum, and average values. When calculating errored seconds for delay, what is compared to the ES threshold is the maximum delay. In other words, an errored second will be indicated if the delay exceeded the ES threshold at any point during the one-second interval.