Alarm dashboard
The Alarm dashboard is reached via Alarms on the main menu. All alarms are collected here: active alarms, manually suppressed active alarms, and automatically cleared alarms. The length of the history displayed can be changed under History interval (click the down arrow to set an arbitrary “from–to” interval).
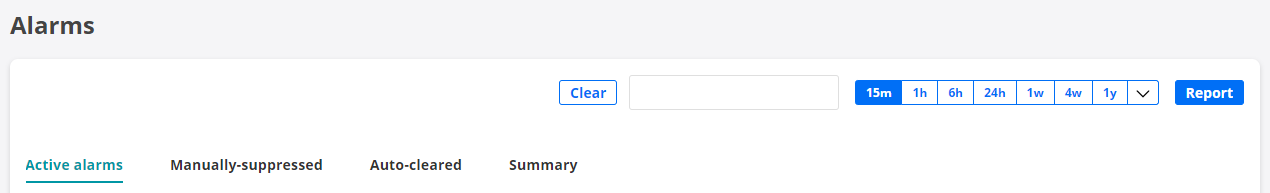
Active alarms
This tab shows all active alarms from all active monitors which have an alarm configured. An active alarm is triggered when the errored second thresholds for the severity level of the alarm are exceeded.
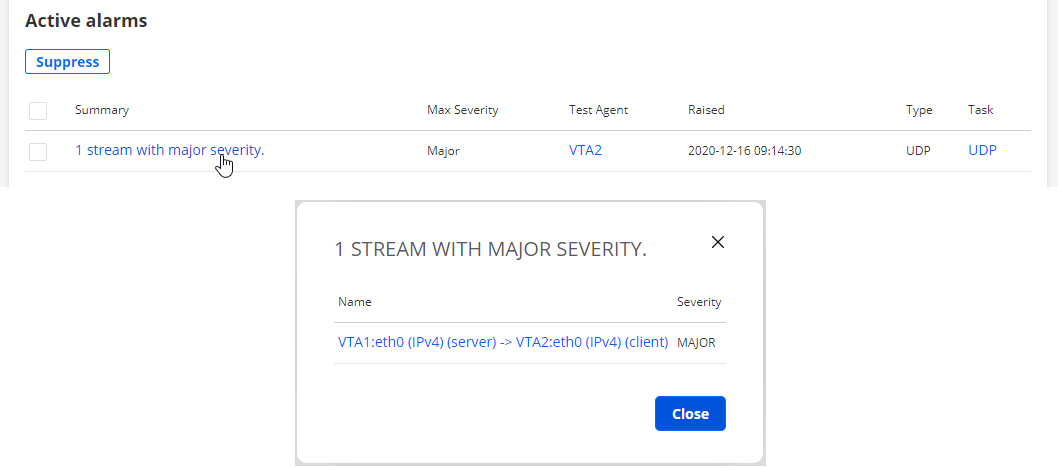
If an alarm has been configured in the form of SNMP traps per stream, the presentation of the alarm will likewise differentiate streams. Below is an example.
Manually suppressed active alarms
This tab shows all manually suppressed alarms. The suppressions are defined as described on the page Setting up alarms.
Automatically cleared alarms
On this tab all cleared alarms are collected. A cleared alarm means that the condition on the measured connection has reverted to normal.
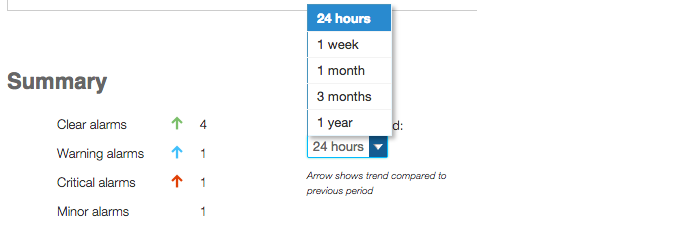
Summary
This tab gives a summary of all alarms by severity during any of a number of predefined time periods (see screenshot below).