Building monitors
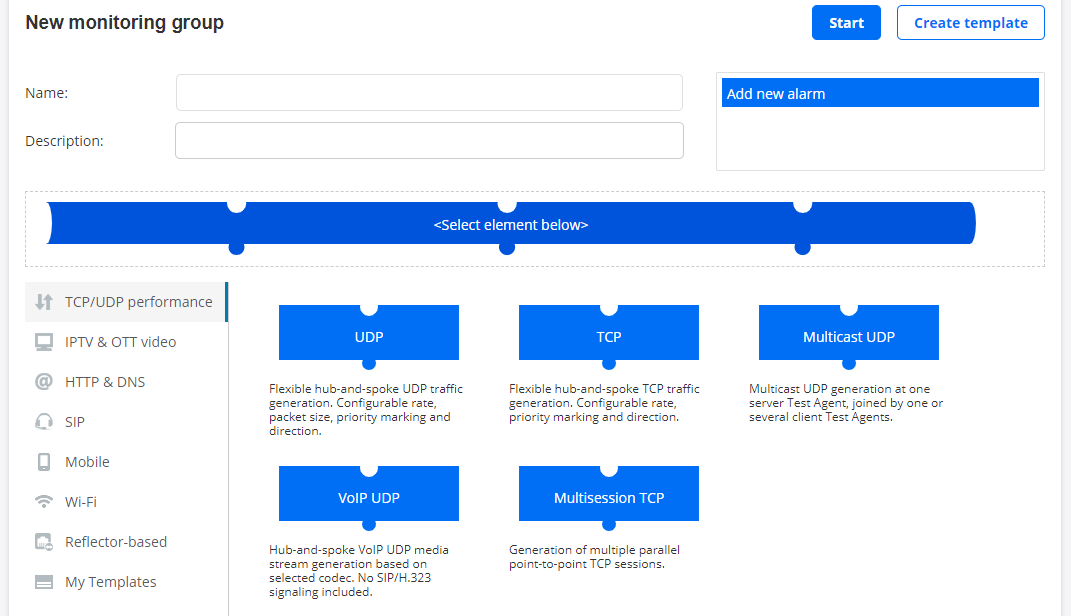
To create a new monitor, click the puzzle piece that represents the desired function.
Proceed to fill in the desired parameters, as exemplified for UDP below. Hover over the “i” symbol for a parameter to view a tooltip explaining it. You can also click the “i” symbol to view a more detailed parameter description in this support documentation (a new copy of it will open on a new tab in your web browser).
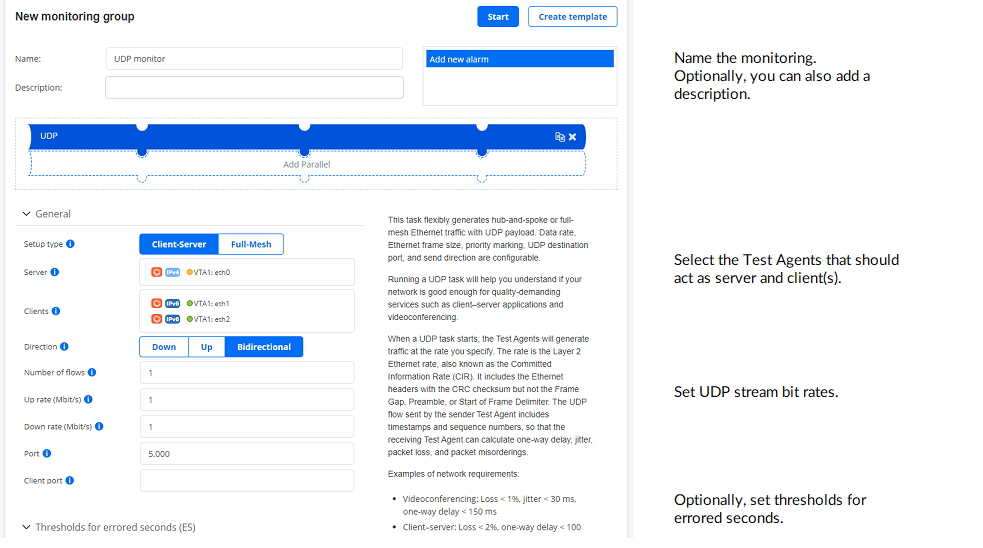
You can apply various filters to the Test Agent interfaces appearing above (in the Server and Clients boxes). Hiding some of these may be useful if you have a large number of Test Agents:
IPv4: Show IPv4 interfaces.
IPv6: Show IPv6 interfaces.
Show offline: Show interfaces of Test Agents that are offline.
Show management: Show management interfaces.
Show external IP: Show external IP addresses of interfaces (configured as described here). They will appear as separate items.
You can add further functions to monitor concurrently with the first one.
To add one more function, click the empty puzzle piece labeled Add Parallel and repeat the above procedure.
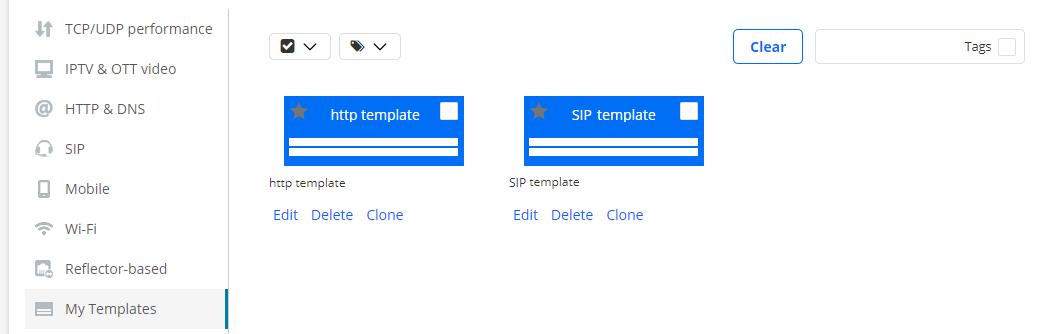
If monitor templates have been defined, you can build your monitor from a template instead. To this end, click the My Templates category on the left, then select the desired template.
Note that you can also configure alarm notifications via email or SNMP traps. This is done in the top section under Add new alarm. See the page Activating alarms for a monitor for more information.
Starting a monitor
Now click the Start button to start the monitor. Results will appear in the Monitoring view as well as in the Dashboard view.