Introduction to Routing Active Testing
Once you have your account set up, you should see the Routing Active Testing Dashboard:
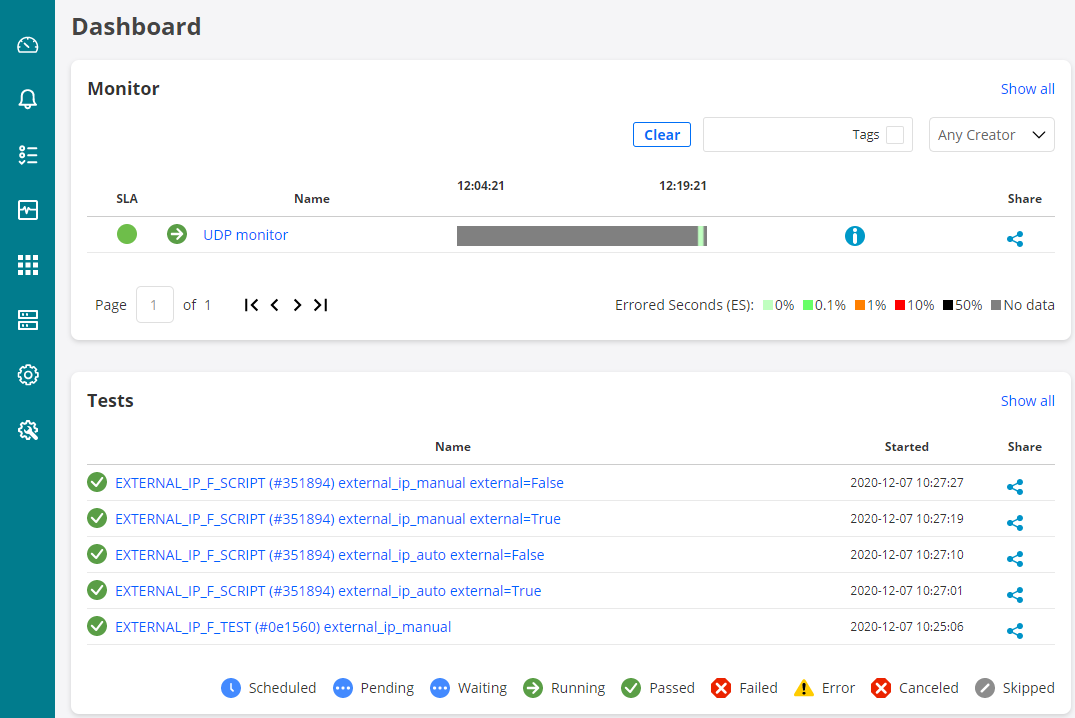
The Dashboard is where your latest tests and monitors will be displayed.
To start monitoring and troubleshooting with all the available features in Routing Active Testing, using your own active traffic generating Test Agents, you can download Test Agent software and install them on your own x86-based hardware or on virtualization platforms. Read more here.
For guidance on preparations for specific measurements supported by Routing Active Testing, see the Getting started pages in this section.