Guided tour of the main menu
Dashboard
The Dashboard gives an overview of the most recent monitors and tests in Routing Active Testing.
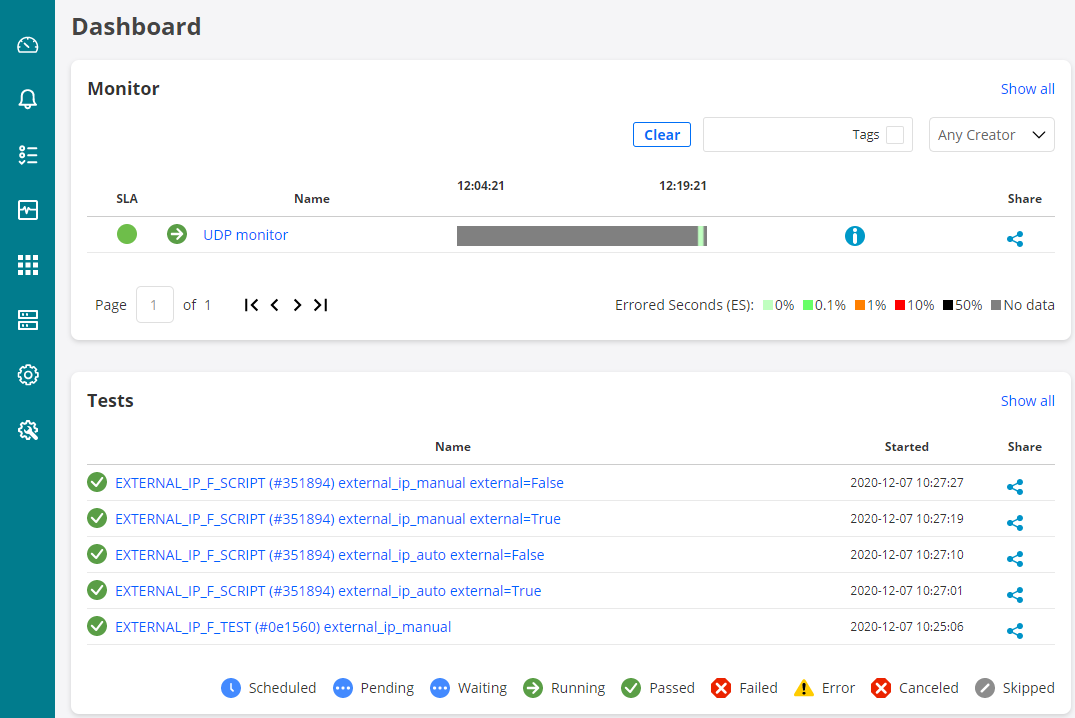
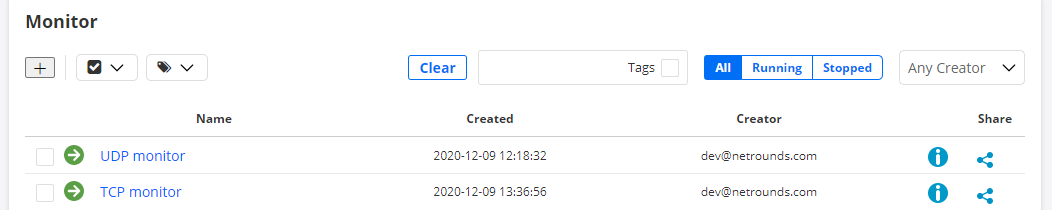
Monitors
An SLA indicator and an errored seconds (ES) bar give direct visual feedback on measured quality. The default time interval for both is 15 minutes; you can select a different time interval at top right, in which case an additional SLA indicator will appear in a column on the far left.
Note
Even if the number of monitors in the system is very large, the 15-minute SLA will not slow down the presentation on the dashboard since this SLA is precomputed. SLAs for other time intervals are not, however, something which you need to keep in mind when working with large monitor sets.
To view log messages for the monitor, hover over the “i” icon. (You may have to change the History interval setting to see this button.) In the callout that appears, click the “Show details” link to view the full message log, as explained on this page.
If an error has occurred while executing the monitor, this is indicated as an “!” icon. Hover over that icon to learn more about the error.
Tests
The start time and a pass/fail indicator are displayed.
The remaining links on the left-side bar take you to further screens, as detailed below.
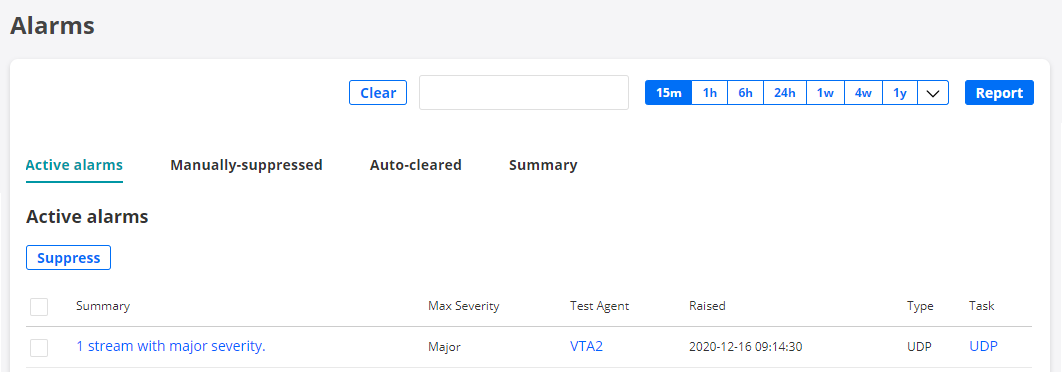
Alarms
This screen displays alarms defined for monitors in Routing Active Testing.
How to set up alarms is explained on this page.
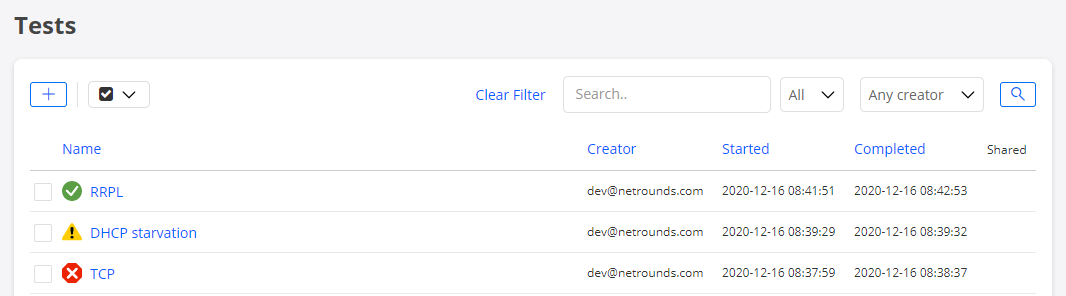
Tests
This screen shows all defined tests. A filter is provided for finding a specific test. To set up a new test, click the Tests button on the left-side bar and select New Test Sequence. Read more here about how to do this.
Monitoring
This screen displays all defined monitors. Here, too, a filter is provided for locating a specific monitor. To set up a new monitor, click the Monitoring button on the left-side bar and select New Monitor. Go to this page for full instructions on how to build monitors.
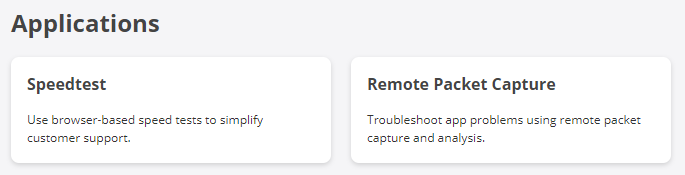
Apps menu
From here you access the Speedtest and Remote packet capture features.
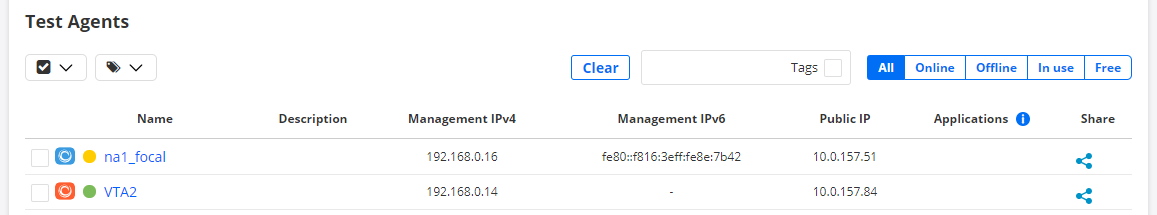
Test Agents
Interface info tab
Under Test Agents, you will find all your registered Test Agents.
Under Test Agents shared with me, any shared Test Agents will show up.
The colored dot immediately to the left of the Test Agent name indicates the current status of the Test Agent:
|
Green: Online and ready, currently not in use |
|
Yellow: Online and currently in use |
|
Gray: Offline |
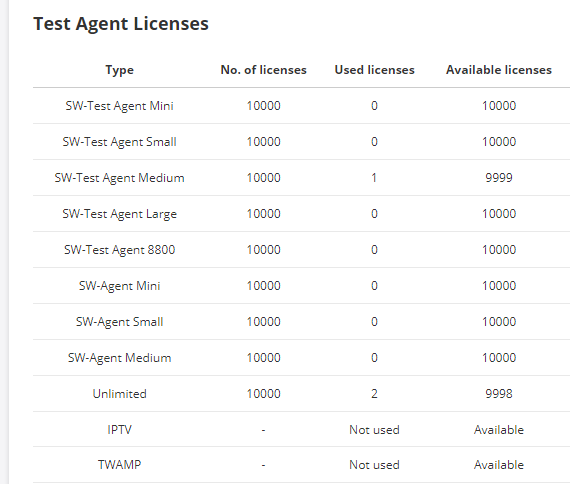
License info tab
Here the license and stream information for your Test Agents is displayed:
License type
Number of available streams and number of streams currently in use.
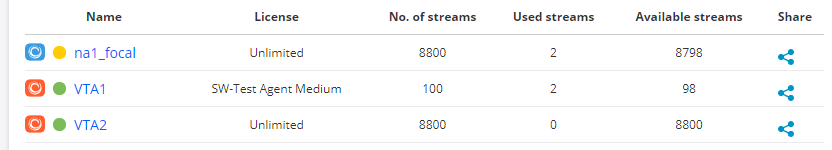
At the bottom, under the heading Licenses, are displayed the types of license connected to your account. Please refer to this page for more detailed information.
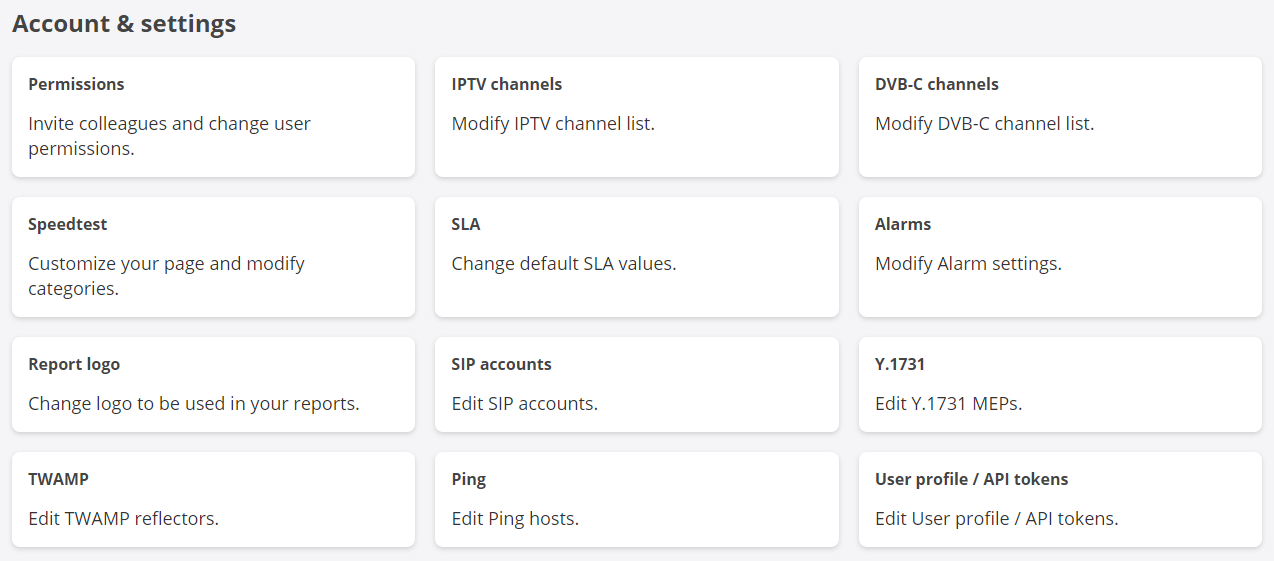
Account
Read more here about the various items under Account & Settings.
Plugins
Read more here about plugins.
Docs
Clicking this button takes you to the contents page of the present documentation.
Top bar: “Bell” button

This button will light up if a notification is received; for example, if an alarm is triggered or if someone shares a Test Agent to your account.
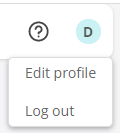
Top bar: User name
Click your Routing Active Testing user name on the top bar in order to:
edit your Routing Active Testing user profile
switch to a different Routing Active Testing account (if you have access to several accounts)
log out from Routing Active Testing.