View showing an individual monitor
Clicking a monitor in the Monitoring view takes you to a new view dedicated to that monitor.
One or several tables like the one below are displayed:
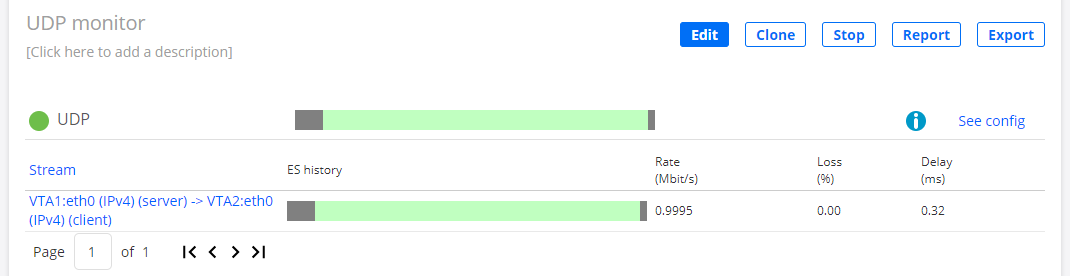
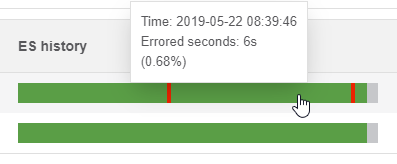
The ES history bar shows the history of errored seconds over the interval specified under Time interval at the top of the page.
Hover the mouse pointer over the ES history bar to identify time instants and view overall errored second statistics.
The table will also in many cases hold various result metrics, as in the above example.
You can click the item on the left in a table (for example, a client or stream) to call up a new window with more detailed monitoring results. These results are formatted the same way as in a test report (see the page Reports on tests and monitors) and are simply a subset of such a report.
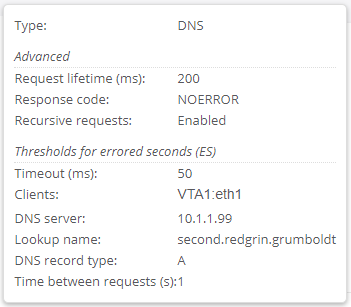
Hover the mouse pointer over the See config link to view parameter settings for the monitor in a tooltip.
The colored dot indicates the SLA fulfillment level. For the color coding, please refer to the page SLA (Service Level Agreement).
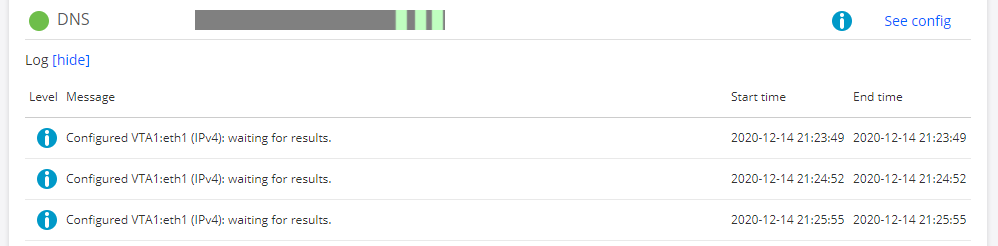
![]() Click this button to show event log messages for the monitoring session. These messages are by default hidden.
Click this button to show event log messages for the monitoring session. These messages are by default hidden.
Additional functionality in this view
Start/Stop button: Click to start the monitor if it is not currently running, or conversely to stop the monitor if it is being executed.
Edit button: Edit the monitor in the monitor builder. A monitor can be edited even if it is running. After you save changes to the monitor, it will continue to execute but now using the new setup. Note, however, that data from any parts of the monitor that you abandon is lost and cannot be recovered later on. For example, if the monitor originally targeted three IPTV channels and you drop one of them, the data collected for that channel is lost. It is a good idea to export monitoring data collected so far before you edit a monitor; see Export button below.
Clone button: Create a copy of this monitor. You are taken to the monitor builder with the settings of this monitor filled in.
Report button: Generate a report on the execution of this monitor. See the page Reports on tests and monitors.
Export button: Export monitoring results in comma-separated format. Again, see the page Reports on tests and monitors for details.
Delete button: Clicking this button will delete the monitor.
Warning
This action cannot be undone, and you are prompted to confirm it.