Reports on tests and monitors
In Routing Active Testing you can easily create reports on tests and monitors, showing a result summary as well as details of the test or monitoring session. These reports can be automatically emailed to you daily, weekly or monthly in order to help you gain insight into the health of your network and to point out potential problem nodes. This page explains all result views and reporting options.
Tests view: Simply click the test you want to create a report on.
Monitoring view: Click the monitor you want to create a report on. Then make a selection under Time interval to specify the time interval to be covered by the report. You can set an arbitrary “from–to” interval by clicking the down-arrow button.
Click the Report button (top right) to open the report in a new window.
The controls at the top of the report window are as follows:

Download PDF button: Download and create a PDF of the report.
Print button: Send the report to a printer.
Show worst: For each task in a test or monitor, you can specify how many measurement results to show, ranked by the number of errored seconds with the worst on top. The scope of a measurement result is task-dependent; to give one example, for HTTP it is the result obtained for one client. The default number is 5.
Show graphs: Check this box to display graphs in the report.
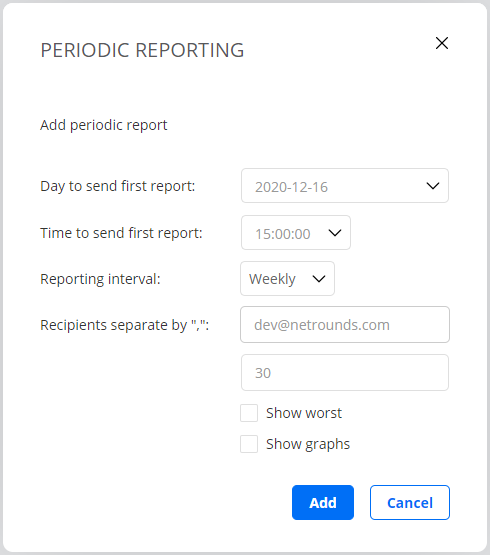
Periodic reporting button: For monitors, you can configure the Routing Active Testing server to send a report periodically at user-specified intervals.
Export data button: Click this button to create a zip file with all test results.
Each result table for the test or monitor is exported to an individual comma-separated file with extension
.csv.For tests whose output consists of an event log, that log is reproduced in a plain-text file with extension
.txt.
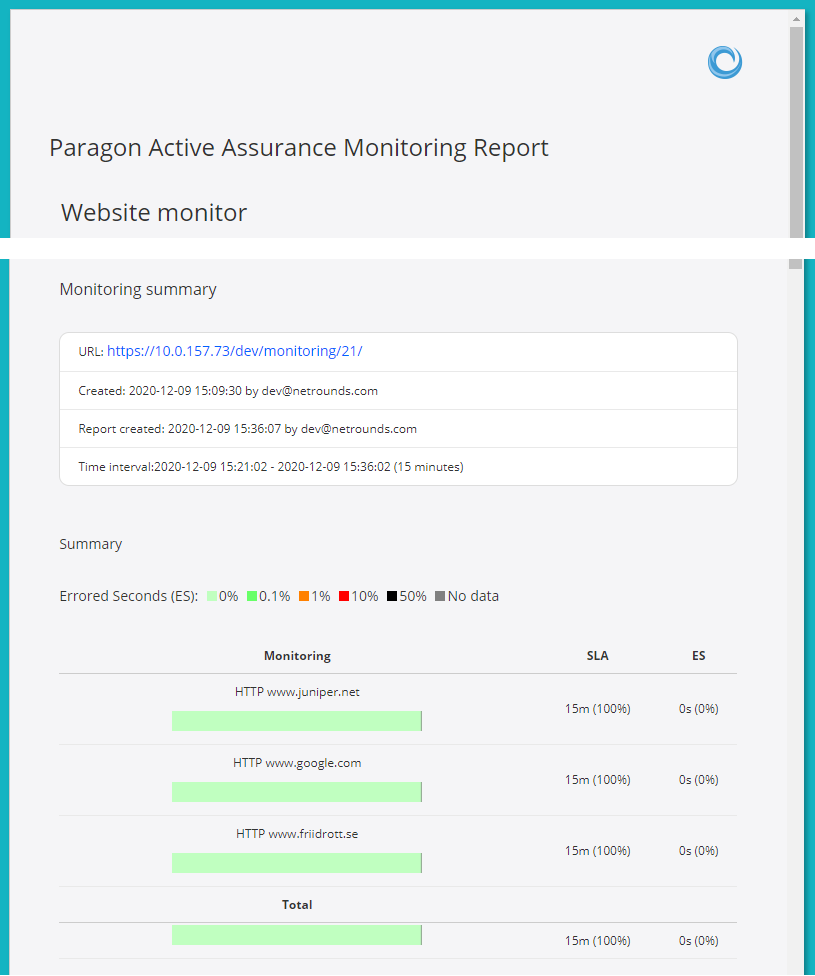
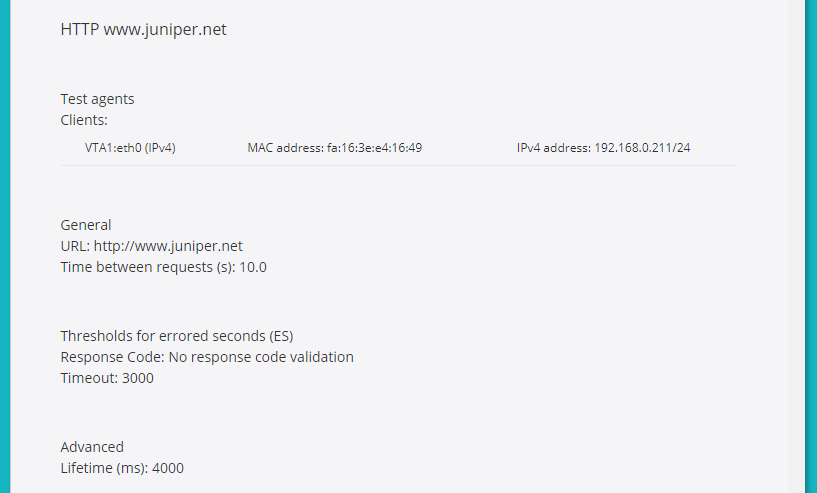
Below are some extracts from a report:
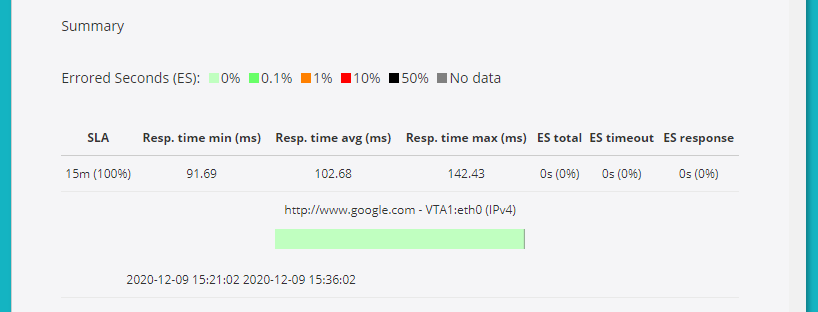
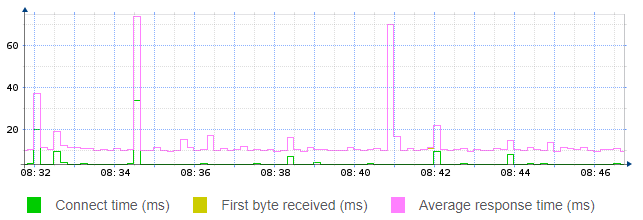
Here is a sample of what the graphs may look like: