TCP
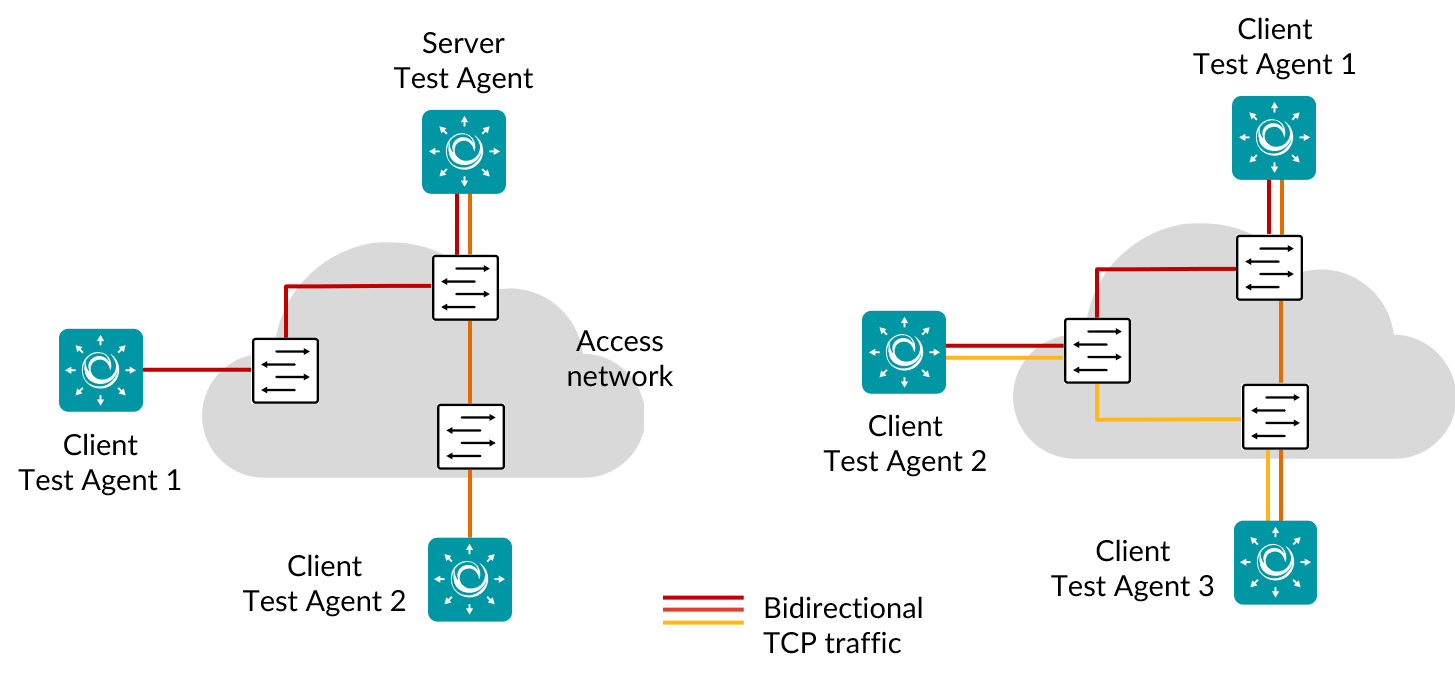
The pictures show hub-and spoke (left) and full-mesh (right) TCP traffic generation, used for performance and throughput measurements.
TCP is a very commonly used protocol, employed for everything from Internet web browsing to client–server applications. By running a TCP task, you will learn about the achievable performance of your network link. Routing Active Testing uses a standard Cubic TCP implementation; for more information, see the page on TCP implementation in Routing Active Testing.
Client Test Agents can be placed behind NAT, since traffic will be initiated from the clients to the server.
When a TCP task starts, the Test Agents will start sending a TCP session between them. This TCP session will compete for the available bandwidth with all other traffic on the network link, thus giving a view of the available performance on that link.
The size of the TCP packet actually sent is determined by the OS/TCP algorithm, just as for a regular user. This is done to faithfully emulate the end-user experience running TCP-based applications.
This task works with both IPv4 and IPv6.
Prerequisites
To run TCP measurements you need to have at least two Test Agents installed. If you haven’t already done the installation, consult the installation guides found here.
Then add a TCP task to your test or monitor and fill in the mandatory parameters below:
Parameters
See the common parameters page for the following:
Parameters that are set on the test step level: Duration, Fail threshold, and Wait for ready.
SLA thresholds for monitors: SLA Good and SLA Acceptable.
Advanced settings common to all test tasks: Delayed start.
General
Setup type: Select how to set up the measurement: “Client-Server” or “Full-Mesh”.
When Client-Server is selected, certain parameters take an “Up” or “Down” prefix to indicate the direction of transmission, whereas for Full-Mesh no such prefix is needed. Default: Client-Server.Server: Test Agent interface that is going to act as server.
If a NAT router or firewall is present, the server must be located on the outer (public) side.Clients: Test Agent interfaces that will participate in the TCP measurement and exchange traffic with the server.
The clients can be placed behind NAT, since traffic will be initiated from the clients to the server.Number of flows: Number of TCP sessions.
If more than one flow is specified, the Client port setting is ignored, and all client ports will be ephemeral. Min: 1. Max: 64. Default: 1. Note: Even if multiple flows are used, a single set of statistics is shown with aggregate values picked for each parameter.Direction: One of: Down (from server to clients), Up (from clients to server), or Bidirectional (in both directions at the same time).
Up rate (Mbit/s): Upstream (client-to-server) target rate for TCP.
The rate specified is TCP goodput, thus including only the TCP payload. If this field is left blank, TCP will not use any rate limitation and will use TCP congestion control. Min: 0.01 Mbit/s. Max: 1,000 Gbit/s.Down rate (Mbit/s): Downstream (server-to-client) target rate for TCP.
The rate specified is TCP goodput, thus including only the TCP payload. If this field is left blank, TCP will not use any rate limitation and will use TCP congestion control. Min: 0.01 Mbit/s. Max: 1,000 Gbit/s.Port: TCP server port to which clients will send traffic.
Range: 1 … 65535. Default: 5000.Client port: (Optional) TCP client port from which clients will send traffic.
If this is omitted, the client will select a port. Range: 1 … 65535.
Thresholds for errored seconds (ES)
Up/Down min rate (Mbit/s): Minimum data rate thresholds. If the TCP data rate (goodput) during one second is lower than this value, an errored second is triggered.
If a threshold is left undefined, no errored seconds will be generated for that direction. Min: 0 Mbit/s. Default: 0 Mbit/s.Up/Down max rate (Mbit/s): Maximum data rate thresholds. If the TCP data rate (goodput) during one second is higher than this value, an errored second is triggered.
If a threshold is left undefined, no errored seconds will be generated for that direction. Min: 0 Mbit/s. Default: By default this field is left blank.
TCP retransmissions cannot cause errored seconds directly, since Routing Active Testing does not count TCP retransmissions. However, as retransmissions will lower the achieved throughput (goodput), you can obtain an indirect measure of them by setting a suitable threshold for the up and down rates.
Advanced
Up/Down DSCP/IPP: The Differentiated Services Code Point or IP Precedence to be used in IP packet headers.
See this page. The available choices are listed in the drop-down box. Default: “0 / IPP 0”.Up/Down VLAN priority (PCP): The Priority Code Point to be used in the VLAN header.
See this page. Range: 0 … 7. Default: 0. Note: When a Test Agent Application attempts to configure PCP settings in outgoing IP packets, it cannot be guaranteed that the settings are indeed carried through. This is because the Test Agent Application does not control the host it is running on and its interface configurations.Socket send buffer (bytes): The socket send buffer size in bytes.
Optional. Min: 1 byte. Max: 10,000,000 bytes. Default: By default this field is left blank, and Linux will then use a dynamic buffer that is adjusted according to usage and available memory.Socket receive buffer (bytes): The socket receive buffer size in bytes.
Optional. Min: 1 byte. Max: 10,000,000 bytes. Default: By default this field is left blank, and Linux will then use a dynamic buffer that is adjusted according to usage and available memory.Client connect delay (s): Configurable delay in seconds until the client initiates a TCP connection towards the server.
Optional. Default: By default this field is left blank, and no delay is applied.Proxy server: If set, the specified server and port will be used as TCP proxy.
Proxy server port: Port to use as TCP proxy port.
Range: 1 … 65535.
Result metrics
Rate (Mbit/s): Received TCP data rate (goodput).
ES: Aggregated errored seconds, taking into account all types of error.
SLA: Service level agreement fulfillment: equal to (100 – ES) %.