Test Agents view
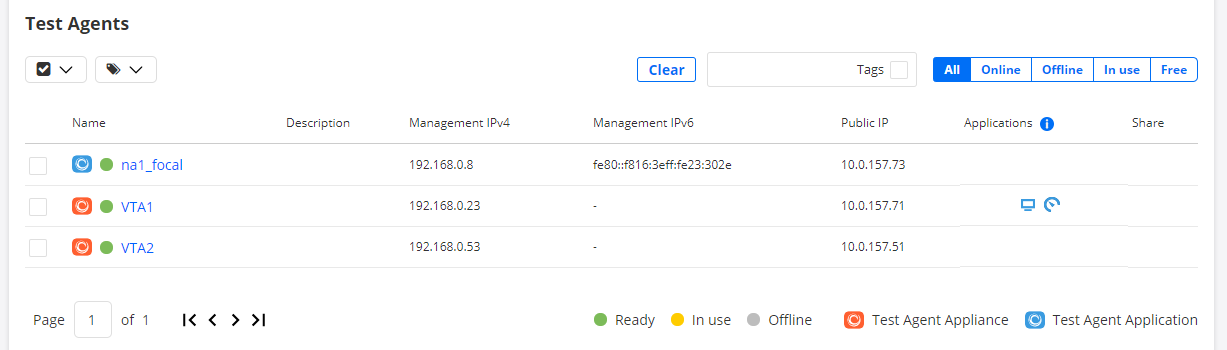
The Test Agents view shows all Test Agents registered to your account. The list is divided into pages with 15 Test Agents on each page.
In the Shared with me section at the bottom, any Test Agents shared to your account from other accounts will appear.
The Download button at the top of the view is used to download Test Agent software. See these pages for more information.
By default, the Test Agents view shows the Interface info tab. Most of this page describes the contents of that tab. For the License info tab, skip to here.
Columns in the Test Agents view
Name column
The first icon on the left indicates the type of Test Agent:
|
Icon used for Test Agent Appliance |
|
Icon used for Test Agent Application |
|
Icon used for generic Test Agent (see below) |
Note
Generic Test Agents. When creating a Test Agent via the REST or NETCONF/YANG API, we cannot know beforehand which type it is: Test Agent Appliance or Test Agent Application. This becomes clear only after the Test Agent has registered. Therefore, in the meantime, the Test Agent is represented by a generic, gray icon in the Test Agent view. Upon registration, the icon will change color to orange (for a Test Agent Appliance) or blue (for a Test Agent Application).
The colored dot icon immediately to the left of the Test Agent name indicates the current status of the Test Agent:
|
Green: Online and ready, currently not in use |
|
Yellow: Online and currently in use |
|
Gray: Offline |
You can filter the Test Agents view with respect to Test Agent status:

Selecting the option Online means that only Test Agents marked with a green or yellow dot will appear, while selecting the option Offline means that only Test Agents marked with a red dot will appear.
Clicking the Test Agent name takes you to a new screen showing Test Agent properties, divided into a number of tabs. See this page.
Description column
Plain-text description of the Test Agent entered in the heading of the Test Agent properties view: see this page.
Management IP column
This column shows the IP address of the Test Agent management interface (this is by default “eth0” for a Test Agent Appliance).
When two addresses are given, in the format “address_1 (address_2)”, the first is the local network IP address used by the Test Agent, for example behind a NAT router or a firewall, and the second is the public IP address seen by Control Center. If only one address is given, the local and public addresses are the same.
Applications column
This column uses icons to show which applications have been enabled on this Test Agent. The enabling is done on the Applications tab of the Test Agent properties, as detailed here.
These are the icons used:
|
Speedtest |
|
Use of Test Agent as proxy |
|
Live remote packet capture |
Share column
For Test Agent Appliances, this column displays an icon indicating the sharing status of the Test Agent. All about sharing of Test Agents is covered on this page.
These icons occur in the main listing, Test Agents:
|
This Test Agent is not currently shared to any other account. |
|
This Test Agent is currently shared to at least one other account. |
This icon is used in the Shared with me listing:
|
This Test Agent is being shared to this account from some other account. |
Actions applicable to Test Agents
You can select one or several Test Agents by selecting the checkboxes on the far left in the Test Agents listing.
Click this button at the top to select or deselect all Test Agents.

You can then perform tagging actions by clicking this button. See this page for further instructions on using tags.

When at least one Test Agent is selected, this additional button appears. You can use it to update the software of the selected Test Agents, or of all Test Agents.

Filtering the Test Agents view
The filter controls are found at the top of the view.

Filtering of Test Agents by status (online/offline) has already been covered here.
You can also filter Test Agents by name, by typing characters into the “Search” text box, or by tag, by selecting the Tags checkbox and then typing or selecting tag names as explained here.
License info tab of the Test Agents view
The License info tab displays license and stream information for the Test Agents.
Name column: Holds the same information as on the Interface info tab.
License column: Shows the type of license assigned to the Test Agent.
No. of streams column: Shows the total number of streams granted by the license.
Used streams column: Shows the number of streams currently in use.
Available streams column: Shows the number of unused streams currently available.
Share column: Shows the same information as on the Interface info tab, but the icons are not clickable.
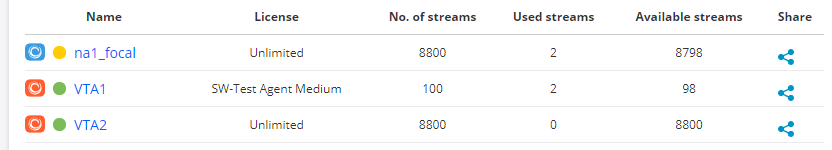
Read more about licensing and streams on this page.
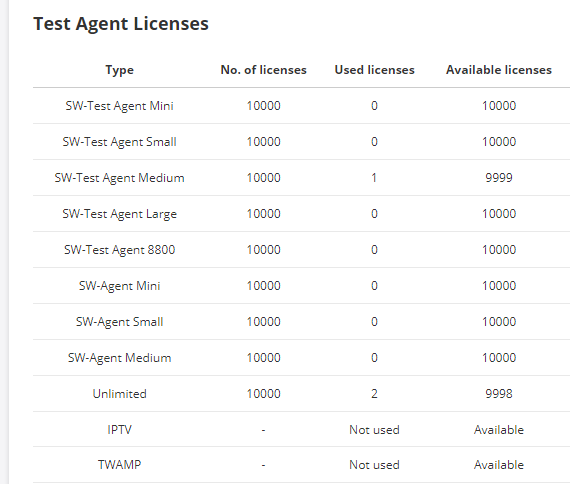
At the bottom, under the heading Licenses, are displayed the types of license connected to your account.
Type: License type.
No. of licenses: Total number of licenses purchased.
Used licenses: Number of licenses currently in use.
Available licenses: Number of unused licenses currently available.
Finally, at bottom right, another table gives the maximum number of streams allowed in the account, the number of streams currently in use, and the number of streams available.
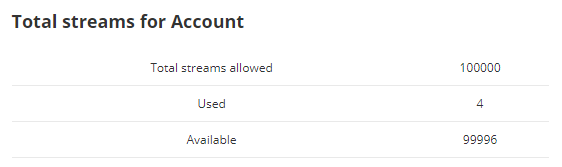
Again, please refer to the page on licensing and streams for more detailed information, especially on the counting of streams for various task types.