Path trace
When data is rerouted in a network, this often results in packet loss, reordering of packets, and jitter. It is important to keep track of how this affects user traffic, and to identify where between two endpoints a problem resides. For these tasks, a path tracing tool is useful.
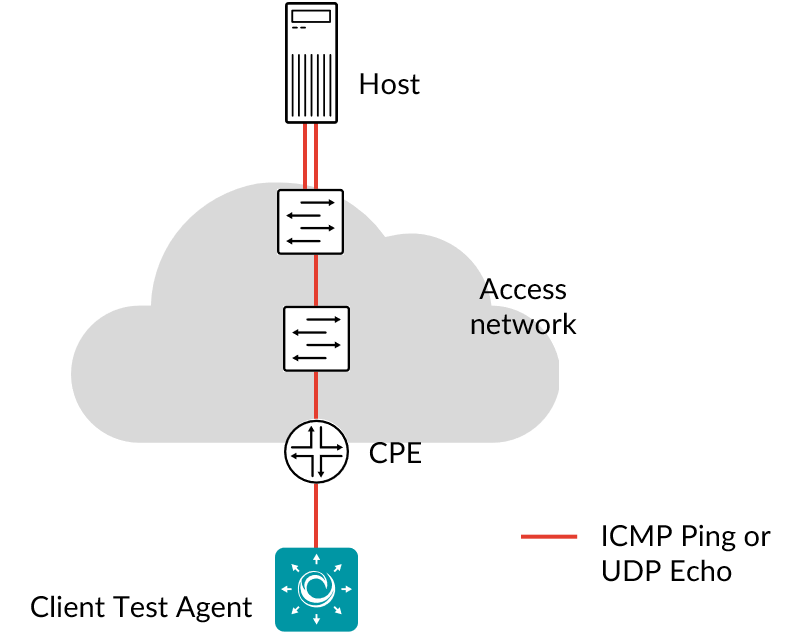
The Path trace tool in Routing Active Testing continuously sends trains of ICMP and/or UDP Echo packets with increasing TTL, and measures the time it takes from sending a packet to receiving an ICMP control message back from each router. Any route changes are detected and recorded.
The Paris traceroute algorithm is used in order to minimize the risk of missing links, or detecting false links, in the presence of per-flow or per-packet load balancing (something which causes difficulties for classic traceroute). Read more about this algorithm here.
In the user interface, routes are visualized in a graph. The times of route changes are collected in a drop-down list, and selecting one of these time instants highlights the route taken at that time in the graph. Each router hop in the graph is labeled with a user-selected ES metric (delay, jitter, or loss), showing the quality experienced for that hop.
A key property of the Path trace tool is the continuous detection of network paths, which keeps the results up-to-date and relevant when the path changes.
The Path trace tool supports both IPv4 and IPv6.
Prerequisites
To run Path trace measurements in Routing Active Testing you need to have at least one Test Agent installed. If you haven’t already done the installation, consult the installation guides found here.
In your test or monitor, add a Path trace task and fill in the mandatory parameters below:
Parameters
See the common parameters page for the following:
Parameters that are set on the test step level: Duration, Fail threshold, and Wait for ready.
SLA thresholds for monitors: SLA Good and SLA Acceptable.
Advanced settings common to all test tasks: Delayed start.
General
Client: Test Agent interface that will act as client, sending packets to the host.
Host: Host to send packets to. Specified as IP address or host name.
Rate (packets/s): Number of Ethernet frames per hop that the client will send each second.
Each Ethernet packet contains one frame. Min: 0.1. Max: 50. Default: 2.Lifetime (ms): Lifetime of a packet.
Lifetime of a packet before it is marked as lost. Min: 0.1. Max: 50. Default: 2.Evaluate thresholds for every hop: Here you select whether to evaluate ES and SES thresholds for every hop.
Default: False.
Thresholds for errored seconds (ES)
Loss (%): Packet loss threshold for triggering an errored second.
If the loss exceeds this value during one second, an ES will be indicated. Min: 0%. Max: 100%. Default: 0%.Delay (ms): Delay threshold for triggering an errored second.
If the delay between server and reflecting router exceeds this value during one second, an ES will be indicated. Min: 0.001 ms. Max: 1000 ms. No default.DV (ms): Jitter threshold for triggering an errored second.
If the jitter (delay variation) between server and clients exceeds this value during one second, an ES will be indicated. Min: 0.001 ms. Max: 1000 ms. No default.Expected DSCP:
The Differentiated Services Code Point or IP Precedence that IP packets are expected to have when arriving at the reflecting router. This is possible to check because each IP packet sent back from the reflector contains an ICMP packet, which in turn contains the modified version of the IP packet sent by the Test Agent. If the DSCP value in the latter packet does not match Expected DSCP, an ES will be indicated. By default, no DSCP validation is done (------selected in drop-down box).
Thresholds for severely errored seconds (SES)
Loss (%): Packet loss threshold for triggering a severely errored second. Min: 0%. No default.
Delay (ms): Delay threshold for triggering a severely errored second. Min: 0.001 ms. No default.
DV (ms): Delay variation threshold for triggering a severely errored second. Min: 0.001 ms. No default.
Advanced
Frame size (bytes): Size of Layer 2 Ethernet frame for the flow.
See this page. Min: 82 bytes. Max: 9018 bytes. Default: 82 bytes.Max TTL: The maximum value of the Time-To-Live parameter. The same parameter also limits the number of flows that can be running in the Path trace tool per test or monitor.
Min: 2. Max: 64. Default: 30.Max results: The maximum number of hops (sum taken over all routes) that can be processed per test or monitor. A warning will be shown if this maximum is reached.
Min: 1. Max: 1000. Default: 128.DSCP/IPP: The Differentiated Services Code Point or IP Precedence to be used in IP packet headers.
See this page. Default: “0 / IPP 0”.Protocol: Network protocol to use for sending Ping packets: ICMP or UDP.
Default: ICMP.UDP port: The UDP port to use.
(Visible only if UDP is selected under Protocol.) Default: 7.Stable period: The number of seconds for which all packet trains must follow the same route in order for a stable state to be assumed.
Min: 3. Max: 60. Default: 10.
Presentation
Overview
The presentation is divided into two tabs, Graph and Result List.
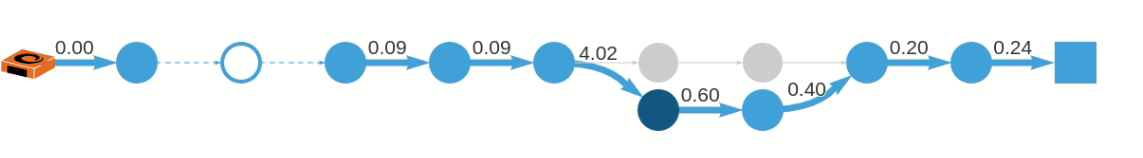
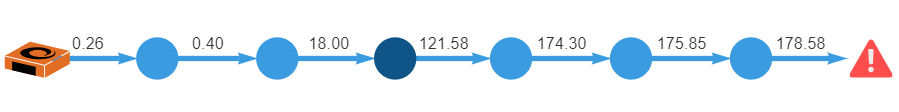
On the Graph tab, which is displayed by default, the route or routes taken from the client (Test Agent) to the host (destination) are presented in a graph showing the successive hops between intermediate routers. The client is represented by a Test Agent icon and the host by a square, while intermediate routers appear as circles. The IP address and DNS name of each router can be viewed in a tooltip.
By default the graph shows the latest route taken, that is, the route taken as a result of the latest reroute event. This is also the route shown when you refresh the page in the browser.
Each hop is labeled with the value of a selected metric. The tooltip for a router, apart from the IP address and DNS name, also displays all metrics computed for the hop which terminates at that router.
The thickness of an arrow indicates how frequently the network path in question has been used: the thicker the arrow, the more often this path has been taken.
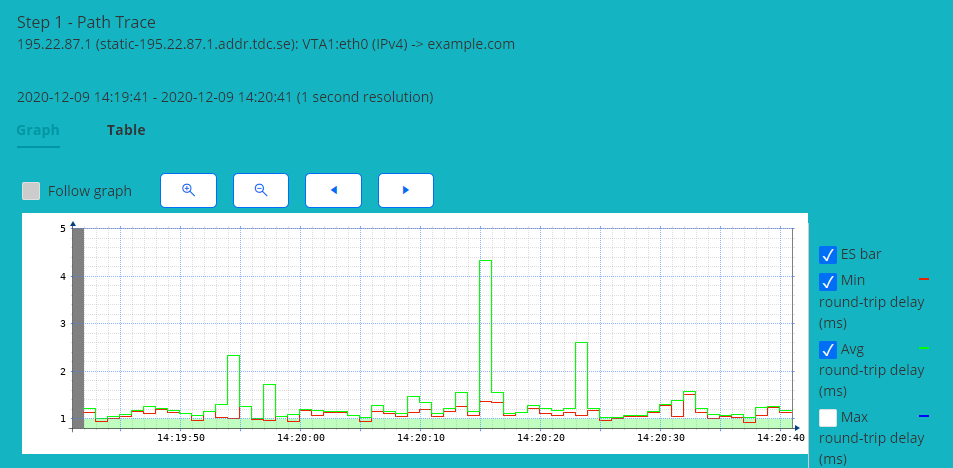
Clicking an arrow opens a separate window with detailed data for this hop:
Clicking a router displays detailed data for the hop terminating at that router.
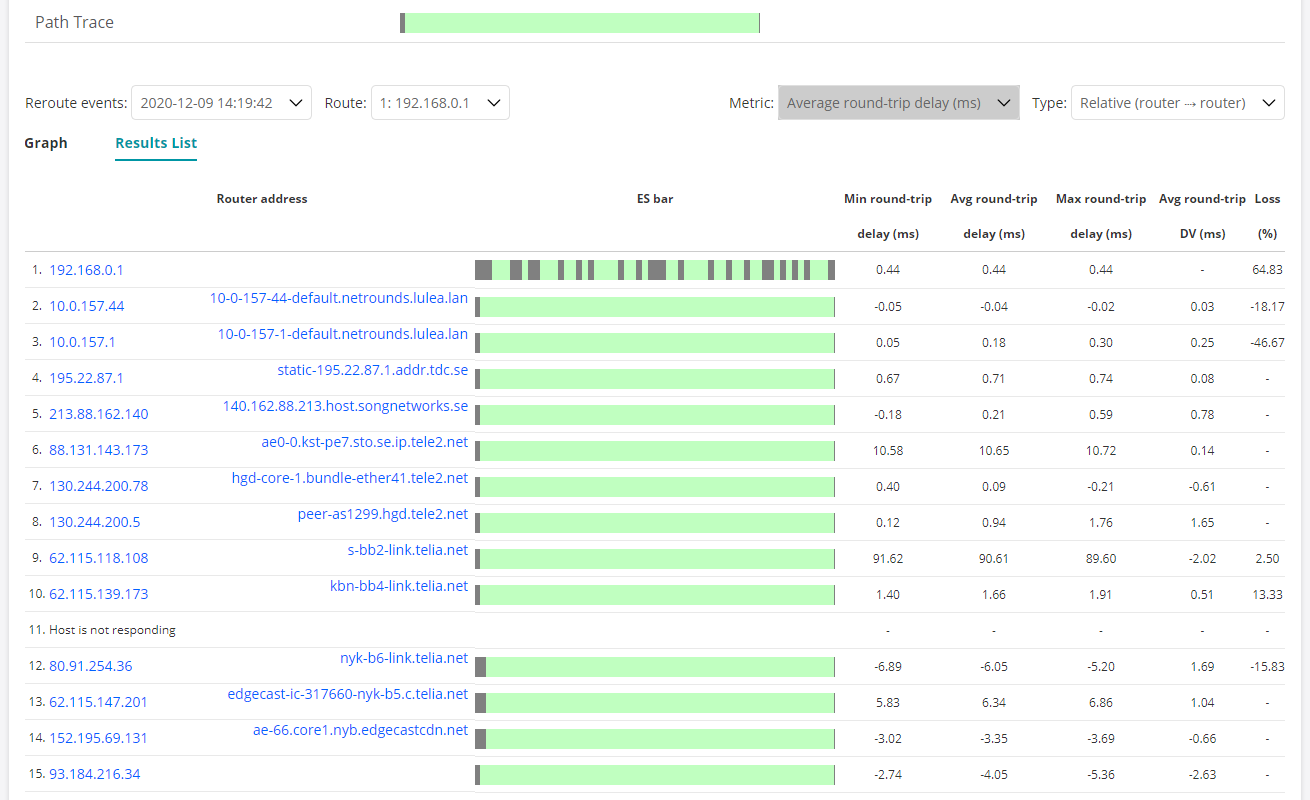
The Results List tab gives a listing of the router hops with errored second bars and metrics in a familiar Routing Active Testing format. See below.
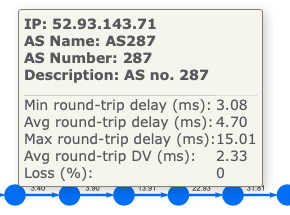
Router tooltip
When you hover over a router in the graph, a tooltip appears showing
the router IP address
the router domain name
the name and number of the AS (autonomous system) to which this router belongs (requires that an AS inventory has been created in the account settings)
for that router, all the metrics that can be selected for display in the graph (see this section).
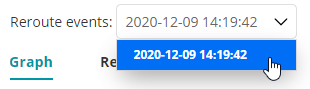
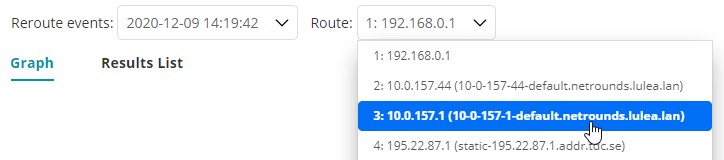
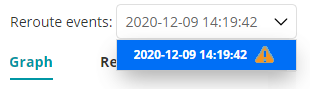
Reroute events box
This drop-down contains all reroute events that have occurred during the Path trace session. The events are listed in reverse chronological order with the most recent on top.
When you select a reroute event, the corresponding route in the graph is redrawn in blue (if it was not blue already). By contrast, routers and edges that are not part of the route currently selected are drawn in gray.
If you click a gray route segment, that segment will be redrawn in blue, and the Reroute events box will switch to the latest reroute event causing this segment to be used.
Route box
This drop-down lists the IP addresses and the DNS names (where resolved) of all intermediate routers that are part of the route currently selected.
When you select an IP address, the corresponding router in the graph is highlighted in dark blue. Conversely, if you click a router in the graph, the Route box is updated to show the IP address and DNS name of that router.
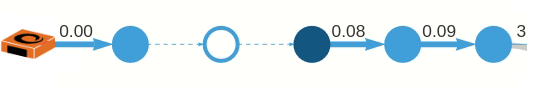
If the IP address of a router could not be determined, it is represented by an asterisk (*) in the drop-down box. In the graph, the router appears as an empty circle (see the above screenshot for an example). The edges adjacent to this router will be dashed and will not be labeled with any metrics. Clicking such edges has no effect, as there is no data to inspect.
Metric box
Here you select what metric to display in the graph. It is one of the following:
Minimum round-trip delay (ms)
Maximum round-trip delay (ms)
Average round-trip delay (ms)
Average round-trip DV (ms)
Loss (%)
All of these are calculated over the time interval between the currently selected reroute event and the reroute event following it. The delay variation is computed at short intervals as described here, and an average is taken over these values.
For a monitor, the inter-event time interval might be cut short by the Time interval display setting, for example, if you set the latter to 15 minutes.
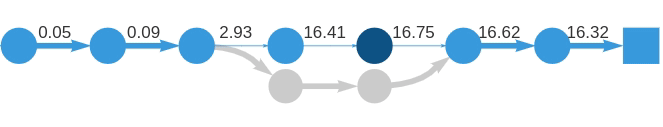
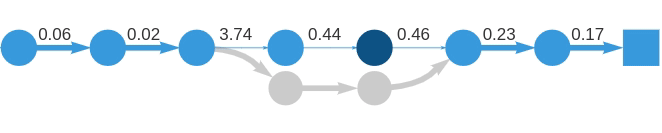
Type box
The Path trace metrics can be calculated in two ways.
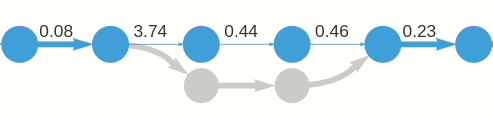
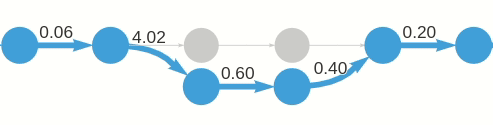
Absolute: The metric shown for an edge in the graph is calculated all the way from the client (Test Agent) to the router where the edge terminates.
Relative: The metric shown for an edge in the graph is calculated for that hop, that is, between the two routers it connects.
An example of each is shown below.


Presentation of failed routes
If a route has failed to reach its destination, that is, Host, the relevant reroute event is labeled with a warning icon:
In the graph, a warning icon is used to represent the destination:
Handling of unresponsive hops
When a hop stops responding (that is, no more packets are received from a router at a given distance = TTL), metrics are calculated for 60 more seconds for that hop. After this time, no more metrics are calculated. Later on, if and when a response is received from a router with the same address, the metrics calculation is resumed, and the route stays the same. If instead a different router responds at the given TTL, a route change is reported.
Modifying the appearance of the graph; graph controls
The graph can be panned and zoomed with the mouse in the usual way. Routers can also be rearranged by dragging. You can revert to the default appearance at any time by clicking the reset button; see below.
At top right are found the following buttons:

Reset graph: This button restores the graph’s default pan and zoom settings and moves all routers back to their default positions. The selections in the drop-down boxes and the graph contents dictated by these selections are not affected.

Full screen: This button zooms the graph to full screen mode. Click the button once more to exit full screen mode.
Results list
The Results List tab shows an errored second bar and metrics for each router hop in a format familiar from elsewhere in Routing Active Testing.
You select a route to present by making a selection in the Reroute events box.
Selecting an item under Route will highlight that row in the list.
The Metric box is disabled, since all available metrics are shown in the list.
Under Type, you can choose between absolute and relative metrics just as in the graph. Read more here.
These metrics are displayed:
Round-trip delay, minimum/average/maximum (ms)
Average round-trip DV (ms)
Loss (%)
For details on how these metrics are calculated, see the Metric box section.