TWAMP/TWAMP Light
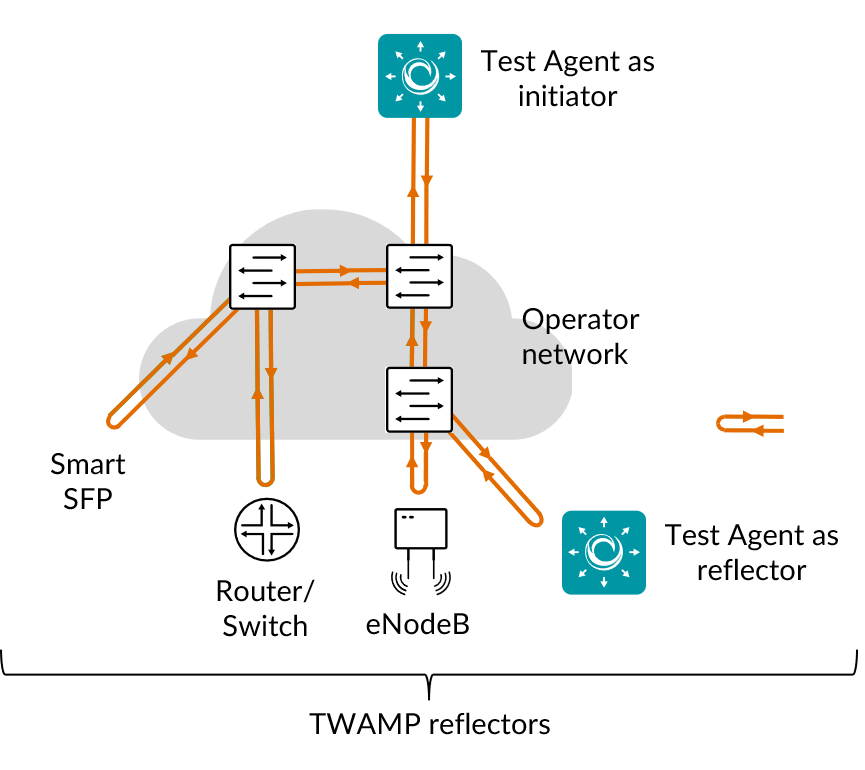
This task uses the Two-way Active Measurement Protocol (TWAMP) for measuring two-way (and in part also one-way) loss and delay. Both full TWAMP and TWAMP Light are supported. Full TWAMP includes the TWAMP control protocol, which performs a handshake between initiator and reflector, while TWAMP Light does not require the control protocol.
Either third-party devices or Test Agents can act as reflectors.
Both full TWAMP and TWAMP Light work with IPv4 as well as IPv6.
Test Agents acting as reflectors support TWAMP Light only.
Prerequisites
To perform TWAMP measurements, you need to install at least one Test Agent and have one or several TWAMP-enabled devices in your network acting as reflectors. The reflector devices may be either third-party devices or further Test Agents.
For guidance on how to deploy a new Test Agent, see the installation guides found here.
To enable TWAMP in third-party equipment, please consult the documentation from your equipment vendor.
A further prerequisite for using third-party TWAMP reflectors is that you have configured them in Routing Active Testing. To enable full TWAMP towards a reflector, a control port must have been set for the reflector.
To use Test Agents as reflectors in this task, you need to specify the Test Agent interfaces to be used as TWAMP Light reflectors in the Test Agent Reflectors parameter.
Once you have finished the above preparations, you can add a TWAMP/TWAMP Light task to your test or monitor, and fill in the mandatory parameters as shown below.
Parameters
See the common parameters page for the following:
Parameters that are set on the test step level: Duration, Fail threshold, and Wait for ready.
SLA thresholds for monitors: SLA Good and SLA Acceptable.
Advanced settings common to all test tasks: Delayed start.
General
Senders: Test Agent interfaces that will act as TWAMP senders.
Reflectors: If you are going to use third-party TWAMP reflectors, select them here.
Note: It is not certain that the port number specified for a reflector in the inventory will in fact be used when the task executes. If this port is not available (for example, blocked by a firewall), the reflector may request a different port for the session, and Routing Active Testing will then accept this request and proceed with the session.Test Agent Reflectors: If you are going to use Test Agents as reflectors, list their interfaces here. The reflector tool is run separately on each interface.
Test Agent Reflector Port: Port to be used by Test Agent reflectors.
Default: 7000.Rate (Mbit/s): Rate at which the senders will send Ethernet frames in Mbit/s.
Each Ethernet packet contains one frame. Max: 10,000 Mbit/s. No default.Rate (packets/s): Number of Ethernet frames the senders will send each second.
Each Ethernet packet contains one frame. Minimum and maximum values correspond to those for Rate (Mbit/s) and depend on the Frame size setting. Min: 2 packets/s. Max: 1,000,000 packets/s. No default.
Changing one Rate parameter will cause the other to adjust automatically to agree with it, based on the Frame size setting.
Time sync: Select “Yes” if the clocks of the Test Agent and the reflector are synchronized via NTP; otherwise, select “No”.
In-band time sync: If NTP time synchronization is not available, select “Yes” to use in-band synchronization instead.
With in-band synchronization, the sender Test Agent uses the timestamps from the TWAMP packets to estimate one-way delay. When starting a test or monitor, it may take about a minute to get good enough synchronization with this method. Please note that in-band synchronization might not be as exact as NTP. However, the algorithm indicates when it judges its estimates to be reliable (good enough convergence), and it also issues a warning whenever it thinks its estimates are currently not reliable.Hardware timestamping: If this is set to Yes, hardware timestamps from the Test Agent’s network interface card will be used for delay and jitter measurements. This requires support for hardware timestamping in the NIC.
If this option is selected and the Test Agent NIC does not support it, an error message will be given, and the measurement will not start. By default, this parameter is set to No, and software timestamps provided by the Linux kernel are used instead. Regarding the two timestamping methods, see below.Reflector timestamping mode: one of STANDARD, FOLLOW-UP-HW, FOLLOW-UP-SW. FOLLOW-UP modes are only supported by Paragon TWAMP reflector plugin.
Timestamping methods
All timestamping for TWAMP in Routing Active Testing, whether originating from hardware or software, uses the SO_TIMESTAMPING interface provided by the Linux kernel. The definitions in this section are taken from ► https://www.kernel.org/doc/Documentation/networking/timestamping.txt.
Hardware timestamping in Routing Active Testing uses the following methods:
SOF_TIMESTAMPING_TX_HARDWARE: Request tx timestamps generated by the network adapter. This flag can be enabled via both socket options and control messages.
SOF_TIMESTAMPING_RX_HARDWARE: Request rx timestamps generated by the network adapter.
Software timestamping in Routing Active Testing uses the following methods; the best method available is selected:
SOF_TIMESTAMPING_TX_SCHED: Request tx timestamps prior to entering the packet scheduler.
SOF_TIMESTAMPING_TX_SOFTWARE: Request tx timestamps from the network interface driver.
SOF_TIMESTAMPING_RX_SOFTWARE: Request rx timestamps when data enters the kernel. These timestamps are generated just after a device driver hands a packet to the kernel receive stack.
Thresholds for errored seconds (ES)
Note
The delay and delay variation thresholds refer to round-trip delay if no time synchronization is used (neither NTP nor in-band), and to one-way delay otherwise.
Loss (%): Packet loss threshold for triggering an errored second.
If the loss exceeds this value during one second, an ES will be indicated. Min: 0%. Max: 100%. Default: 0%.Delay (ms): Delay threshold for triggering an errored second.
If the delay between server and reflector exceeds this value during one second, an ES will be indicated. Min: 0.001 ms. Max: 1000 ms. No default.Delay variation (ms): Delay variation threshold for triggering an errored second.
If the jitter (delay variation) between server and clients exceeds this value during one second, an ES will be indicated. Min: 0.001 ms. Max: 1000 ms. No default.Expected DSCP:
The Differentiated Services Code Point or IP Precedence that IP packets are expected to have on being received from the reflector device. If the received DSCP value does not match this, an ES will be indicated. By default, no DSCP validation is done (------selected in drop-down box).
Thresholds for severely errored seconds (SES)
Note
The delay and delay variation thresholds refer to round-trip delay if no time synchronization is used (neither NTP nor in-band), and to one-way delay otherwise.
Loss (%): Packet loss threshold for triggering a severely errored second. Min: 0%. No default.
Delay (ms): Delay threshold for triggering a severely errored second. Min: 0.001 ms. No default.
Delay variation (ms): Delay variation threshold for triggering a severely errored second. Min: 0.001 ms. No default.
Advanced
Packet fragmentation
Don’t fragment packet: Controls whether the packet that exceeds the MTU is allowed to be fragmented. Be aware that enabling fragmentation (by specifying the “No” option) may cause performance degradation both in the network and in the sending or receiving Test Agents.
Note
This setting has no effect on IPv6 packets.
Percentiles
You can specify two percentiles for delay values. The nth percentile for a distribution means the smallest value which n percent of the data points does not exceed. Commonly used percentiles include the 90th and 99th, which informally mean “90% (99%) of the data points are below this value”.
Note
The thresholds below refer to round-trip delay if no time synchronization is used (neither NTP nor in-band), and to one-way delay otherwise.
First delay percentile (%): First delay percentile, e.g. 90.
Threshold for first delay percentile (ms): Threshold for triggering an errored second based on the first delay percentile.
SES threshold for first delay percentile (ms): Threshold for triggering a severely errored second based on the first delay percentile.
Second delay percentile (%): Second round-trip delay percentile, e.g. 99.
Threshold for second delay percentile (ms): Threshold for triggering an errored second based on the second delay percentile.
SES threshold for second delay percentile (ms): Threshold for triggering a severely errored second based on the first delay percentile.
Note on percentile accuracy
The closer to 100% you set a percentile, the more measurement samples are required to reliably determine the corresponding delay value. For example, if you set a percentile to 99.99%, then you need 10,000 samples to get one sample above the threshold. Even then, the resulting metric is based on a single outlier, so for a more reliable result still more samples are needed.
In the results, a warning is indicated for a computed percentile if there are not at least two samples above the percentage threshold.
Other
Frame size (bytes): Size of Layer 2 Ethernet frame for the flow.
See this page. Min: 87 bytes. Max: 9018 bytes. Default: 1518 bytes. If you change this setting, the Rate (packets/s) setting will adjust automatically, with Rate (Mbit/s) kept constant.DSCP: Differentiated Services Code Point or IP Precedence to be used in IP packet headers.
See this page. The available choices are listed in the drop-down box. Default: “0 / IPP 0”.VLAN priority (PCP): The Priority Code Point to be used in the VLAN header.
See this page. Min: 0. Max: 7. Default: 0.Random padding: Use random or all zeroes as padding in TWAMP test traffic. If enabled, random padding is used.
Default: Yes.UAS period length: The smallest number of consecutive severely errored seconds (SES) that will cause a period of unavailability to be detected.
The UAS concept is described in more detail here. Normally, this parameter is fixed at 10 seconds, but for TWAMP it is configurable. Min: 1 s. Max: 300 s. Default: 10 s.Accept UDP checksum zero for IPv6: Some TWAMP reflectors sets the IPv6 UDP checksum to zero. If enabled, these packets are accepted anyway.
Default: Yes.
Periodic streams
By default, Ethernet frames are sent continuously without a break at the rate specified. Alternatively, you can configure a bursty transmission pattern using the parameters in this section. The Test Agent will then repeat a cycle where it transmits at the rate specified by the Rate parameters for a given length of time, and then stays silent for the remainder of the cycle. See the diagram below.
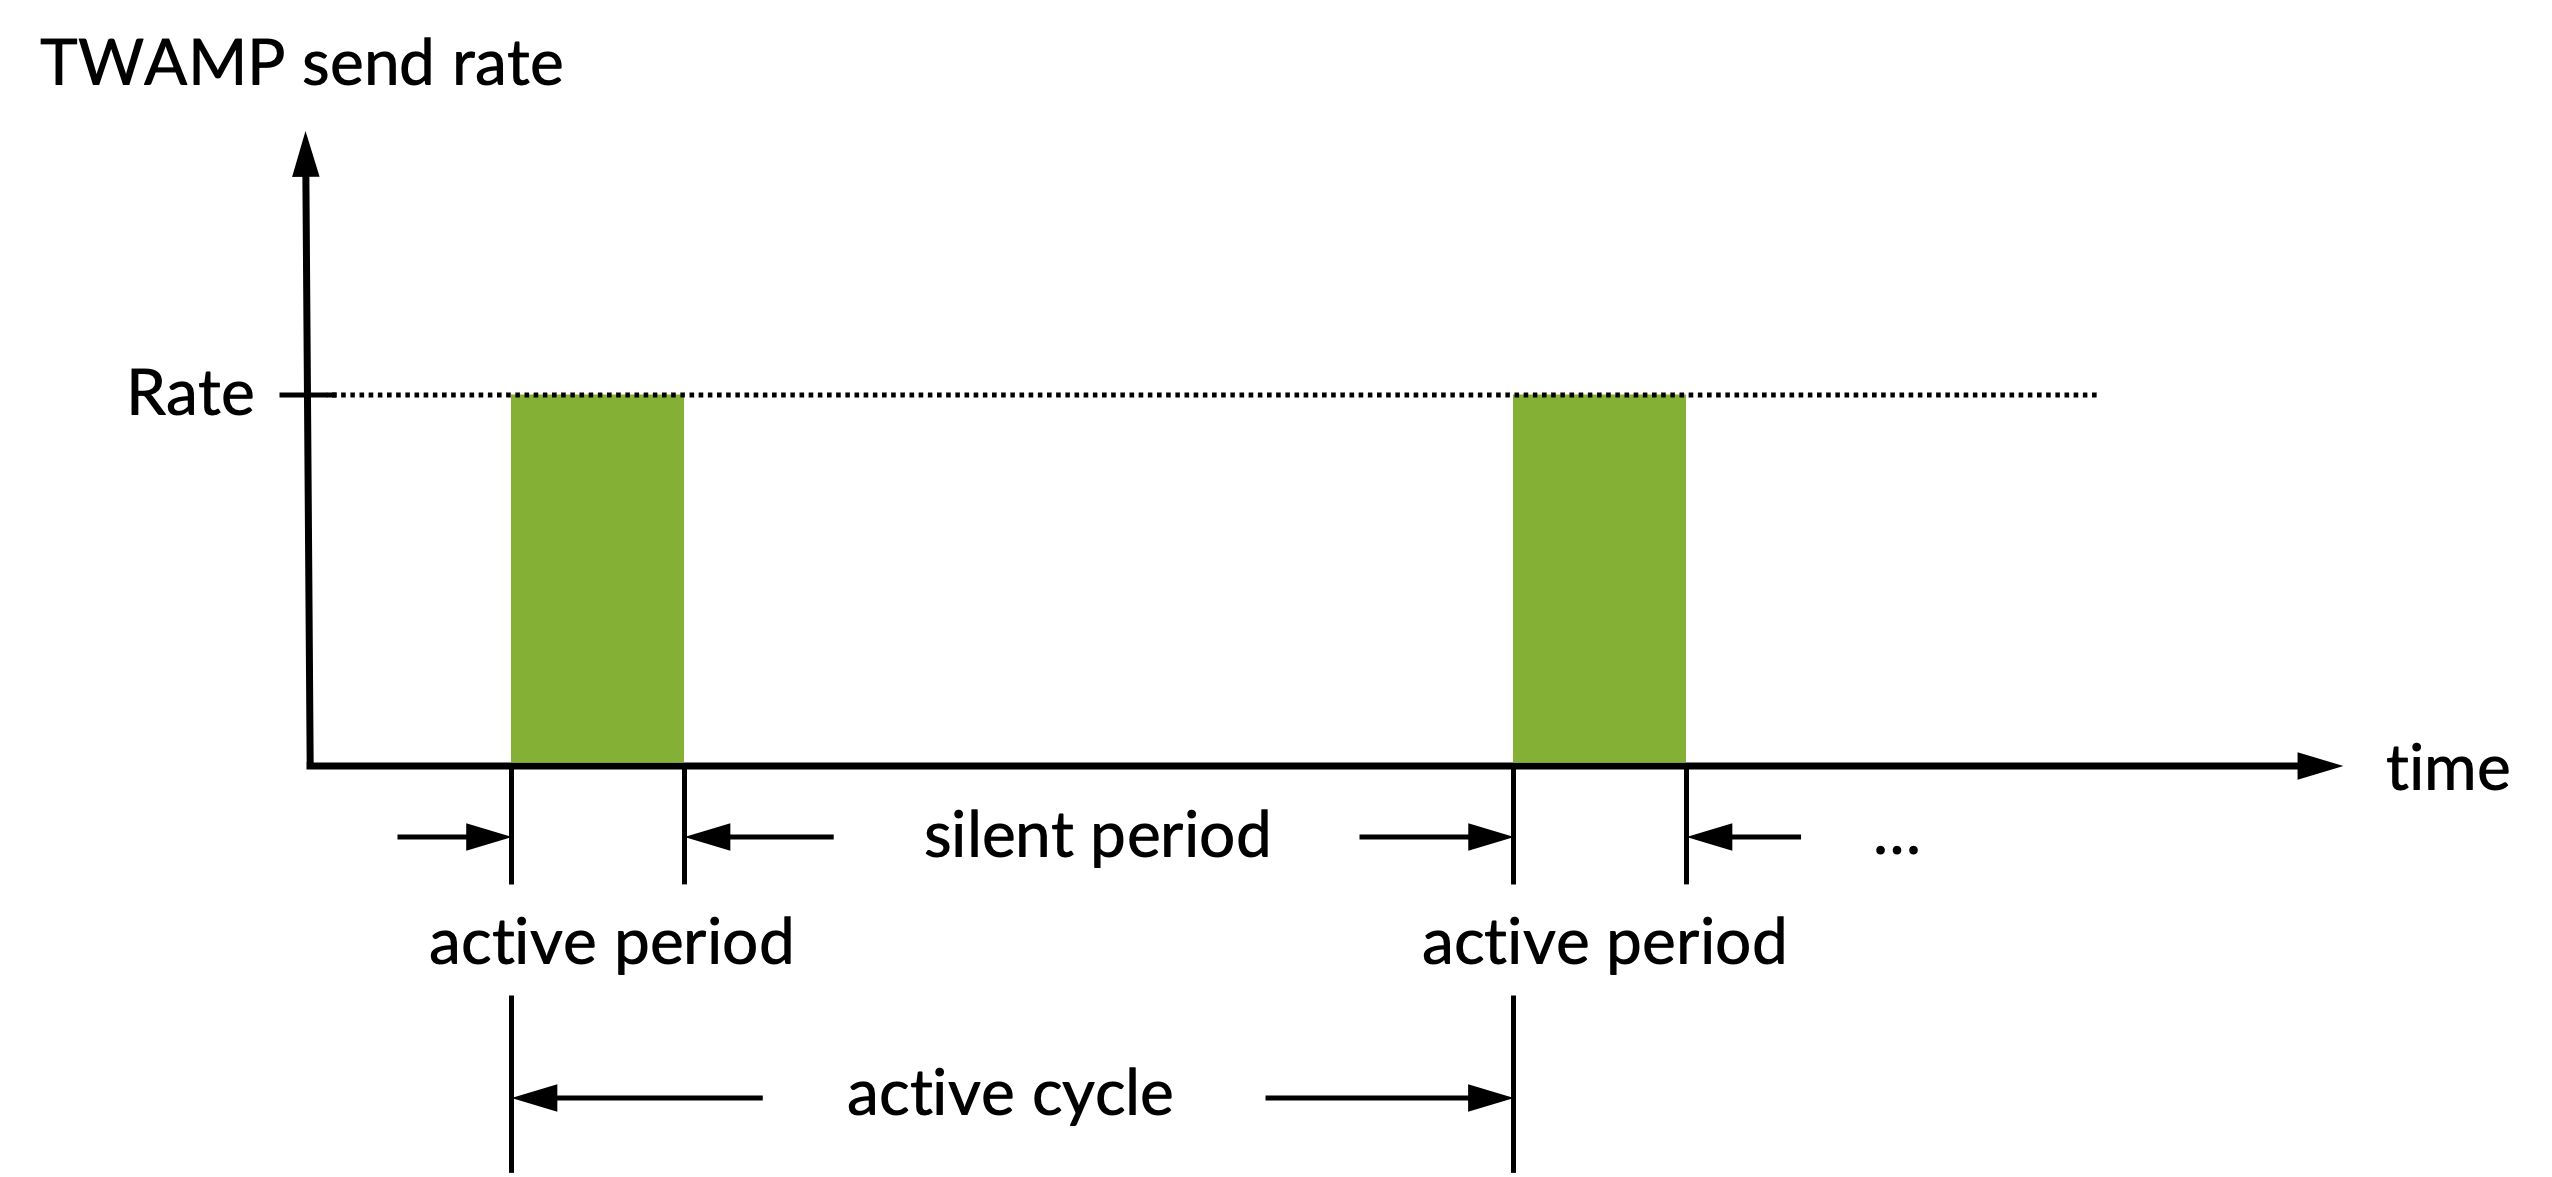
Active period duration (ms): Length of the period in each cycle during which Ethernet frames are sent.
Min: 1 ms. Max: 3,600,000 ms = 1 h.Active cycle (s): Length of the cycle starting with an active period and ending with a silent period. The cycle length must be at least equal to the length of the active period.
Min: 1 s. Max: 604,800 s = 7 days.Report metrics during inactive periods: If enabled, reports metrics related to inactive periods of a periodic test.
Default: No.
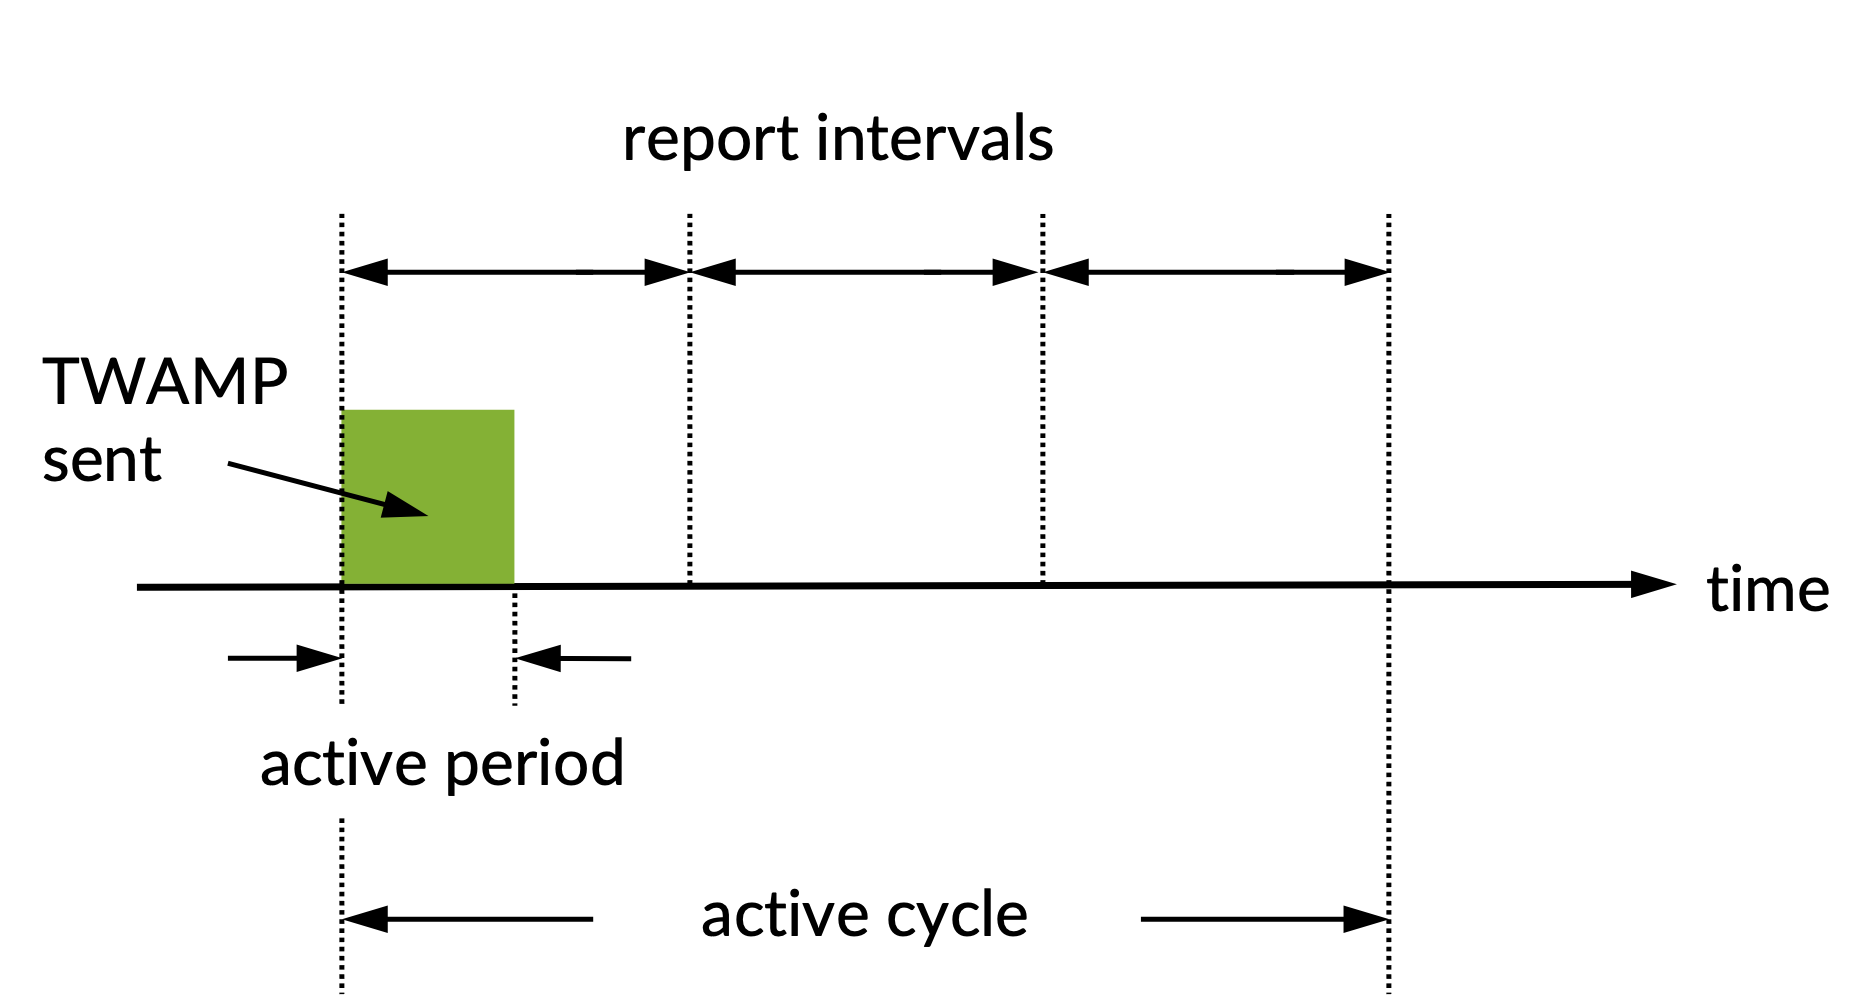
Whenever possible, active periods will be aligned to report intervals, so that an active period will always be contained in a single report. For this to be possible, however, the following conditions must be satisfied:
The active period must be shorter than or equal to the report interval.
The active cycle must be a multiple of the report interval (since otherwise the active period will drift and sometimes straddle two reports).
The diagram below gives an example where the active cycle is three times the report interval.
The report interval is
always 10 s for monitors;
for tests, equal to ceil(
test_length) seconds, wheretest_lengthis the length of the test in hours. That is, for any short test, the report interval is 1 second; for tests more than an hour in length, the report interval increases by 1 second for each hour of testing.
Result metrics
Note
“Far-end” refers to the direction towards the reflector. “Near-end” means from the reflector back towards the sender Test Agent.
Rate (Mbit/s): Rate at which the senders received TWAMP packets.
Min round-trip delay (ms): Minimum round-trip delay.
Average round-trip delay (ms): Average round-trip delay.
Max round-trip delay (ms): Maximum round-trip delay.
Average round-trip DV (ms): Average round-trip delay variation.
Received packets: Number of packets received.
Round-trip loss (%): Round-trip packet loss in percent.
Round-trip lost: Number of lost packets, round-trip.
Far-end loss (%): Packet loss in percent, far-end.
Far-end lost: Number of lost packets, far-end.
Far-end misorders: Number of misordered packets, far-end.
Min far-end delay (ms): Minimum one-way far-end delay.
Average far-end delay (ms): Average one-way far-end delay.
Max far-end delay (ms): Maximum one-way far-end delay.
Far-end DV (ms): Far-end delay variation.
Near-end loss (%): Packet loss in percent, near-end.
Near-end lost: Number of lost packets, near-end.
Near-end misorders: Number of misordered packets, near-end.
Min near-end delay (ms): Minimum one-way near-end delay.
Average near-end delay (ms): Average one-way near-end delay.
Max near-end delay (ms): Maximum one-way near-end delay.
Near-end DV (ms): Near-end delay variation.
First round-trip delay percentile: First delay percentile for round-trip delay.
Second round-trip delay percentile: Second delay percentile for round-trip delay.
First far-end delay percentile: First delay percentile for far-end delay.
Second far-end delay percentile: Second delay percentile for far-end delay.
First near-end delay percentile: First delay percentile for near-end delay.
Second near-end delay percentile: Second delay percentile for near-end delay.
ES (%): Aggregated errored second (ES) percentage, taking into account all types of error.
ES loss (%): Accumulated errored second percentage for packet loss.
ES delay (%): Accumulated errored second percentage for two-way delay.
ES delay variation (%): Accumulated errored second percentage for delay variation.
ES DSCP (%): Accumulated errored second percentage for DSCP.
SES (%): Aggregated severely errored second (SES) percentage, taking into account all types of error.
Unavailable seconds (%): Unavailable second (UAS) percentage.
SLA: Service level agreement fulfillment: equal to (100 – ES) %.