TWAMP Reflector
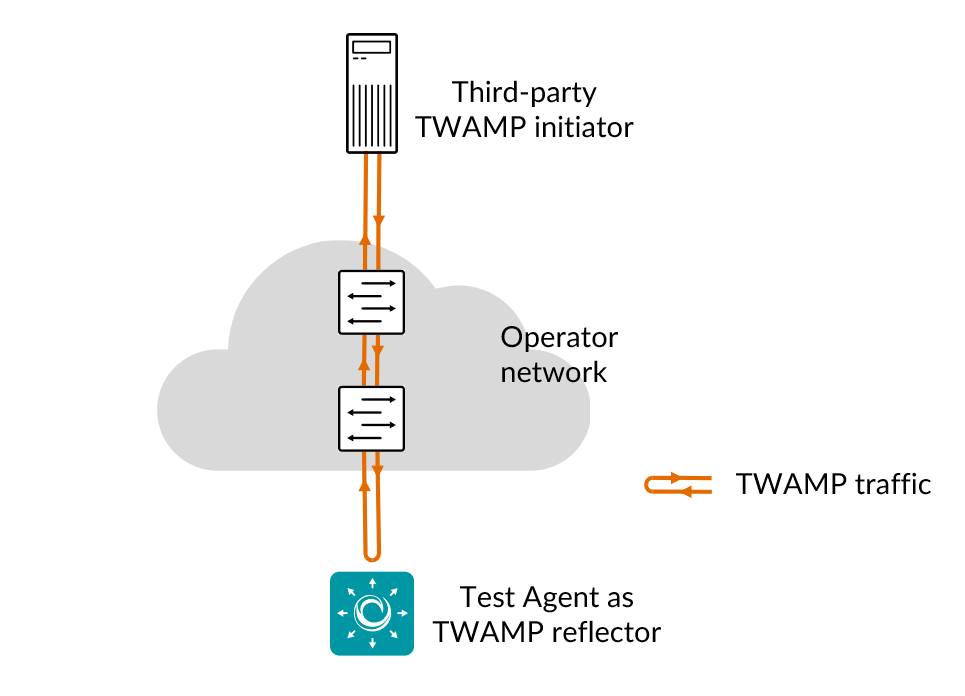
The TWAMP Reflector task starts Test Agent TWAMP reflectors and collects basic metrics from these reflectors as they respond to third-party senders.
At present, the Test Agent TWAMP reflectors only support the TWAMP Light protocol. This means they have no control channel support.
Both IPv4 and IPv6 are supported by Test Agent TWAMP reflectors.
Prerequisites
To run a TWAMP Reflector task, you need to install at least one Test Agent and have one or several TWAMP-enabled devices in your network.
For guidance on how to deploy a new Test Agent, see the installation guides found here. The procedure is different depending on what kind of hardware you have available. Regarding how to enable TWAMP on your equipment, please consult the documentation from your equipment vendor.
You also need to have third-party equipment acting as TWAMP senders.
Parameters
See the common parameters page for the following:
Parameters that are set on the test step level: Duration, Fail threshold, and Wait for ready.
SLA thresholds for monitors: SLA Good and SLA Acceptable.
Advanced settings common to all test tasks: Delayed start.
General
Test Agent Reflectors: Test Agent interfaces that will act as TWAMP reflectors.
Test Agent Reflector Port: Port to be used by Test Agent TWAMP reflectors.
Note
Test Agent TWAMP reflectors will not show up in the TWAMP reflector inventory under Account. Rather, they are started and stopped dynamically along with the TWAMP Reflector task itself.
If you want to use Test Agent reflectors in a TWAMP/TWAMP Light task, we recommend that you point directly to these reflectors when configuring the task: see this page.
For special use cases, you might want to start the Test Agent TWAMP reflectors, add them manually to the TWAMP inventory as detailed on this page, and then use these reflectors in the TWAMP/TWAMP Light task.
Thresholds for errored seconds (ES)
Rate (Mbit/s): Threshold rate for severely errored second.
Result metrics
Rate (Mbit/s): Actual rate at which the senders sent TWAMP packets.
Received packets: Number of packets received.
Received bytes: Number of bytes received.
ES (%): Aggregated errored second (ES) percentage, taking into account all types of error.