Viewing Test Agent status and properties
To inspect the current status, current activity, and various properties of a Test Agent, click Test Agents on the main menu, then click the Test Agent in the listing that appears. The screenshot below shows an example.
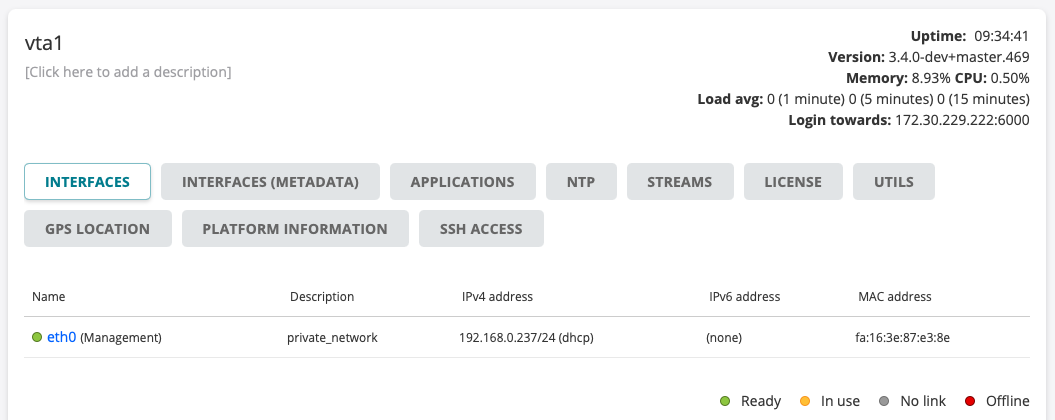
This page explains the status information found at top right on this screen. For coverage of the tabbed dialog beneath it, turn to the other pages in this section.
Test Agent status information (top right)
Uptime: The time the Test Agent has been online since logging in.
If the Test Agent is offline, a string “`OFFLINE` since: <date and time>” is displayed instead to help you understand why this is so; you can correlate that date and time with known actions and events.
Version: Version of Test Agent software. If newer software is available, an up arrow is shown next to the version number:

You can then click the arrow in order to upgrade the Test Agent software to the latest version.
Note
The upgrade will briefly impact performance as the Test Agent will reboot soon after initiating the upgrade procedure.
Memory: Memory currently in use on the Test Agent.
CPU: Current CPU load on the Test Agent.
Load avg: Average CPU load over the last 1 min, 5 min, and 15 min periods.
Login towards: Usually, this is the login server to which the Test Agents are connected. However, if a proxy is used, the proxy address is shown here instead.